OverviewHarmonic market rotations, measured.
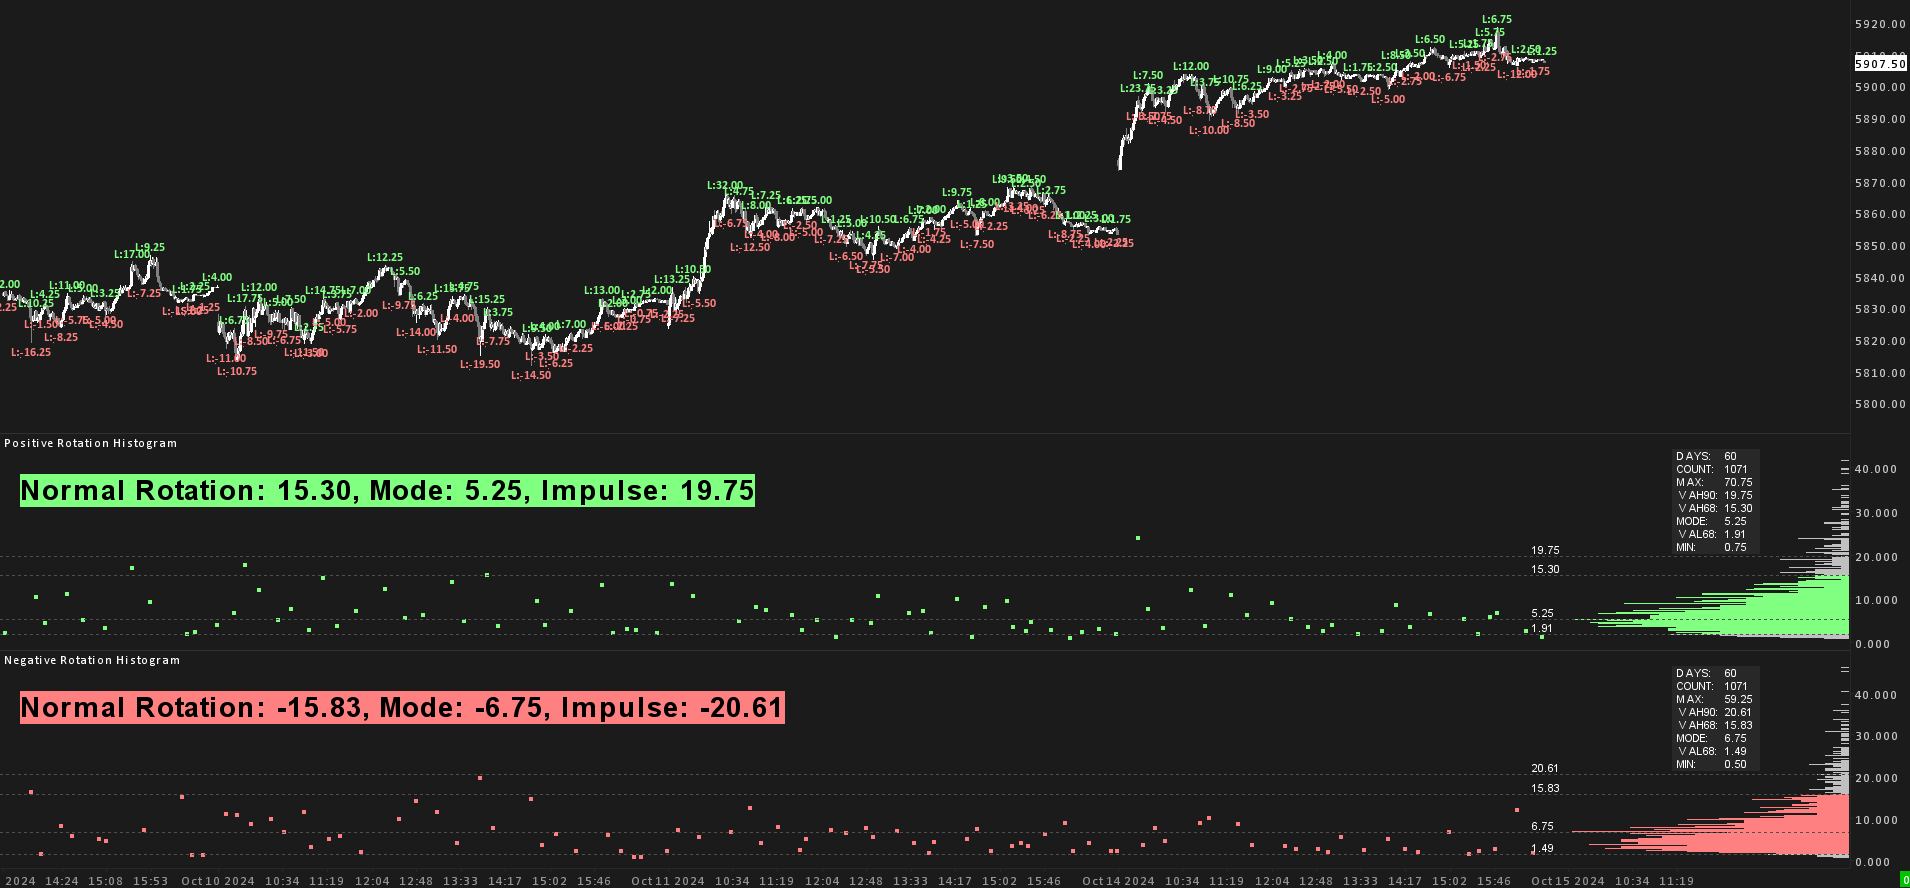
This study calculates and displays a histogram of market rotations based on a
ZigZag study input. It helps identify ‘normal’ and ‘impulsive’ rotations
from statistical calculations, letting you spot moves with a higher probability of continuation.
A practical use is risk management: place stop losses beyond typical rotation sizes to reduce the
chance of getting stopped out by market noise.
It supports multiple methods for calculating value areas (Standard Deviation and
Frequency-Based), offers Winsorization to handle outliers, and ships a fully integrated alert system
with custom thresholds for detecting abnormal rotations across multiple markets. You can base the
calculations on the Mode instead of the Mean, and every element is customizable in position, size
and color, optimized for smooth OpenGL performance in Sierra Chart.
Calculation methodsTwo ways to define “normal”.
01Standard Deviation Method
Key value areas are calculated from the Mean of all rotations. Because markets tend to be
right-skewed, with most rotations clustered around the Mode while extreme outliers push the Mean
higher, two tools handle the skew:
- Winsorization: optionally caps extreme outliers at a threshold (e.g. 90th
percentile) so the Mean better represents the bulk of rotations.
- Mode-based calculation: base the math on the Mode instead of the Mean to focus
on the majority of rotations and ignore extreme outliers.
- Value Area Low (VAL68) = Mean (or Mode) − 1 standard deviation.
- Value Area High (VAH68) = Mean (or Mode) + 1 standard deviation.
- Impulse Area (VAH90) = Mean (or Mode) + 1.666 standard deviations.
02Frequency-Based Method
Works like a volume profile's value area: starting from the most frequent rotations around the
Mode, it accumulates them until 68% of all rotations are included, highlighting the most common
market behavior while reducing the impact of outliers.
- Value Area: the most common rotation bins are prioritized until 68% of total
rotations are reached, giving a clear picture of ‘normal’ behavior.
- Impulse Area (VAH90): calculated from the 90th percentile, marking rotations
considered impulsive.
Additional featuresBuilt for the desk.
-
Alerts. Built-in notifications when rotations exceed your thresholds. Scan multiple
markets for impulse rotations in the background.
-
Customizable display. Adjust the positioning, sizing and color of histogram bars,
borders and text to your liking.
-
OpenGL compatibility. Fully compatible with OpenGL for a smooth workflow inside
Sierra Chart.
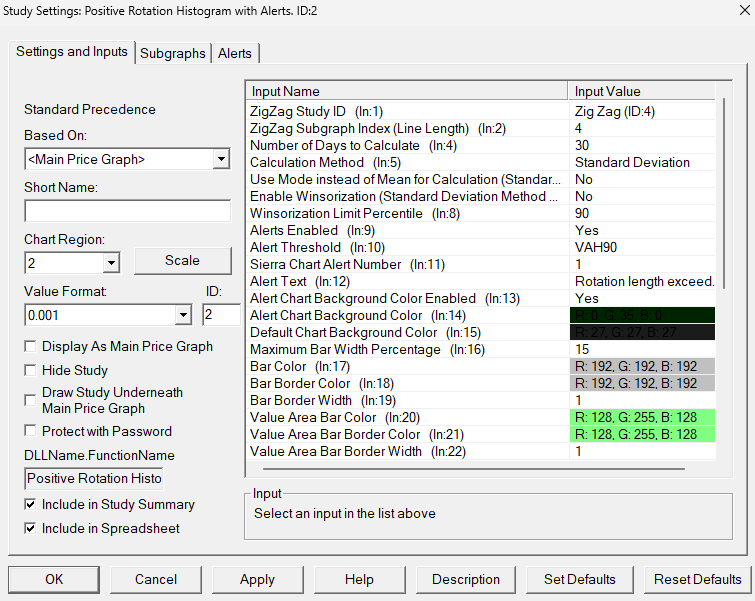
Every element configurableStudy settings
Good to knowFAQ.
How do I get access after subscribing?
At checkout you provide your Sierra Chart Account Name (Help → About →
Account Name / Username). Within 24 hours we add you to the list of users authorized to use the
study. Restart Sierra Chart and open the automatically downloaded chartbook.
Is there a free trial?
Yes - both subscription plans (monthly and annual) start with a 7-day free trial:
you won't be charged until the trial ends, and you can cancel anytime before then. The lifetime
plan is a one-time purchase, so there's no trial.
Can I use the indicator on all symbols?
Yes. The indicator builds on Sierra Chart's built-in ZigZag study: it takes the
generated rotation sizes and runs its statistics on top. It works on any chart and any symbol
where the ZigZag study is applied and has generated values.