Guide

Speed & Performance.
Keep Sierra Chart fast.

Seven settings that keep Sierra Chart smooth under heavy orderflow charts - from disk and GPU to data load and studies.

  1. Run from an SSD Hardware

    Sierra Chart constantly reads and writes its Data folder. On a mechanical drive that disk I/O is the bottleneck; on an SSD it effectively disappears.

    • Keep the SierraChart\Data folder on an SSD (NVMe is ideal).
    • Avoid network drives or external HDDs for live data.
  2. Enable OpenGL Global Settings

    OpenGL hands chart drawing to your GPU, freeing the CPU and making pan and zoom noticeably smoother on dense charts.

    • Global Settings › Graphics Settings → tick Use OpenGL for Chart Graphics.
    • Seeing artifacts on an old GPU? Update the graphics driver first.
    Sierra Chart settings with 'Use OpenGL for Chart Graphics' checked
    Fig. 01 · OpenGL setting
  3. Spread charts across sub-instances Global Settings

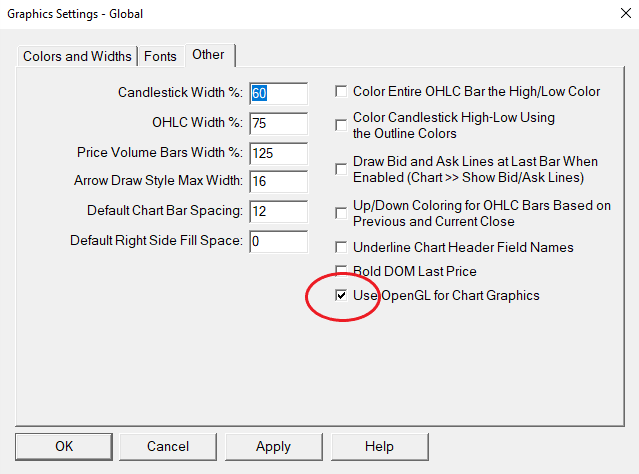
    By default Sierra Chart runs in a single process. Sub-instances let it use several CPU cores, so a heavy chartbook stays responsive instead of fighting for one core.

    • Global Settings → enable additional instances and assign chartbooks to them.
    • Put your heaviest charts (footprint, DOM, heatmap) on their own instance.
    Sierra Chart Global Settings menu showing the sub-instances option
    Fig. 02 · Sub-instances
  4. Raise the chart update interval Chart Settings

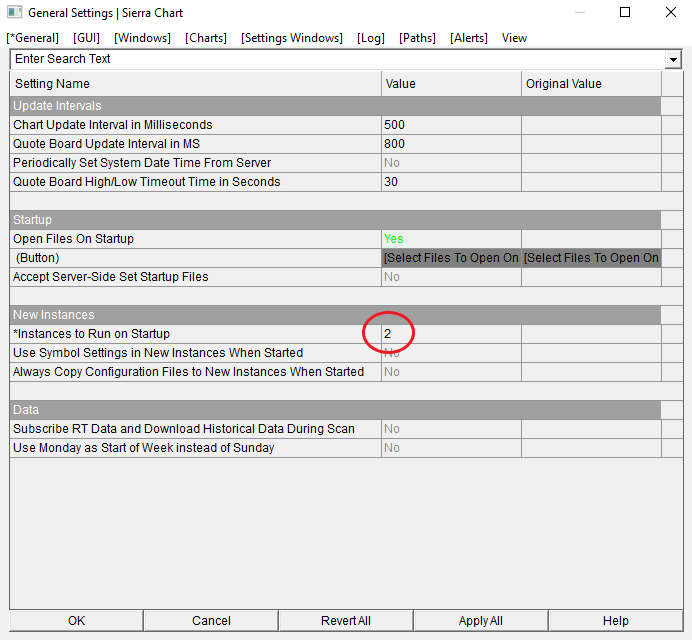
    The update interval controls how often a chart redraws. A slightly higher value cuts CPU load with no real change in how the chart reads.

    • Chart Settings › Chart Update Interval → try 500 ms on heavy charts.
    • Lower it only on the one or two charts where you need tick-by-tick refresh.
    Sierra Chart settings showing the Chart Update Interval option
    Fig. 03 · Update interval
  5. Load only the history you need Chart Settings

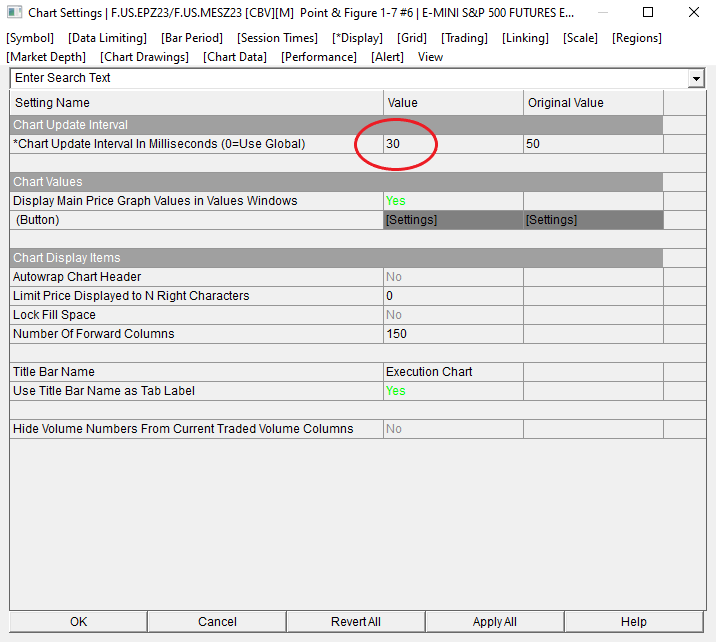
    Every extra day of intraday data is more to load, store and recalculate. Cap each chart to the lookback you actually trade.

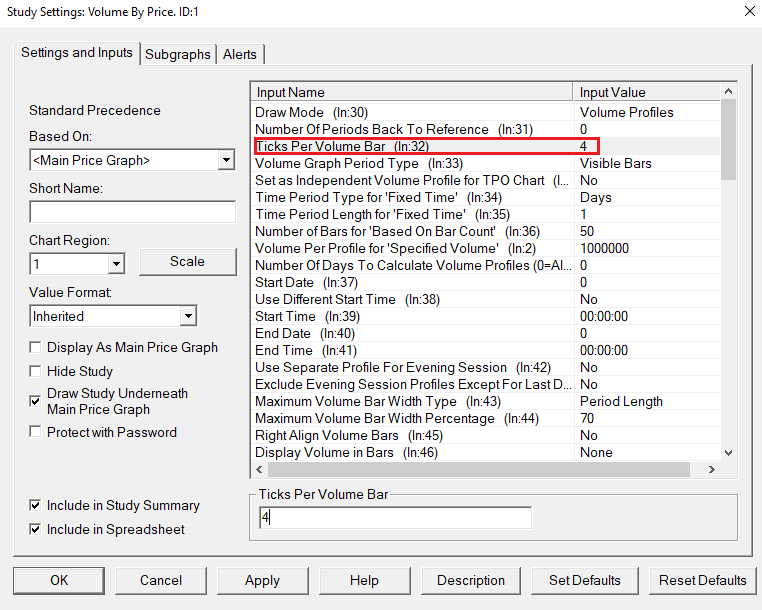
    • Chart Settings › Days to Load → keep it to your real lookback.
    • Reserve long histories for the few charts that genuinely need them.
  6. Coarsen Volume Profile tick size Study Settings

    A Volume Profile draws a row per price tick. On high-resolution instruments that is thousands of rows; a larger tick size renders the same profile far faster.

    • Right-click the chart → Studies → open the Volume Profile study.
    • Increase the tick size until the profile draws smoothly.
    Right-clicking a chart and selecting Studies to reach the Volume Profile settings
    Volume Profile study settings window highlighting where to adjust tick size
    Fig. 04 · Volume Profile tick size
  7. Remove studies you don't use Chart

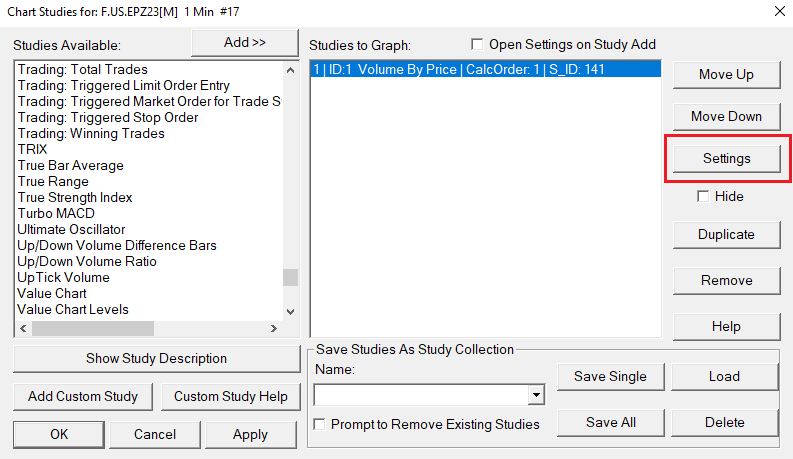
    Every study recalculates on each update. Trimming the ones you don't actively trade is the simplest way to reclaim CPU.

    • Keep only the studies your strategy actually uses.
    • Duplicate-heavy studies (multiple profiles, large moving averages) cost the most.
Scroll to Top