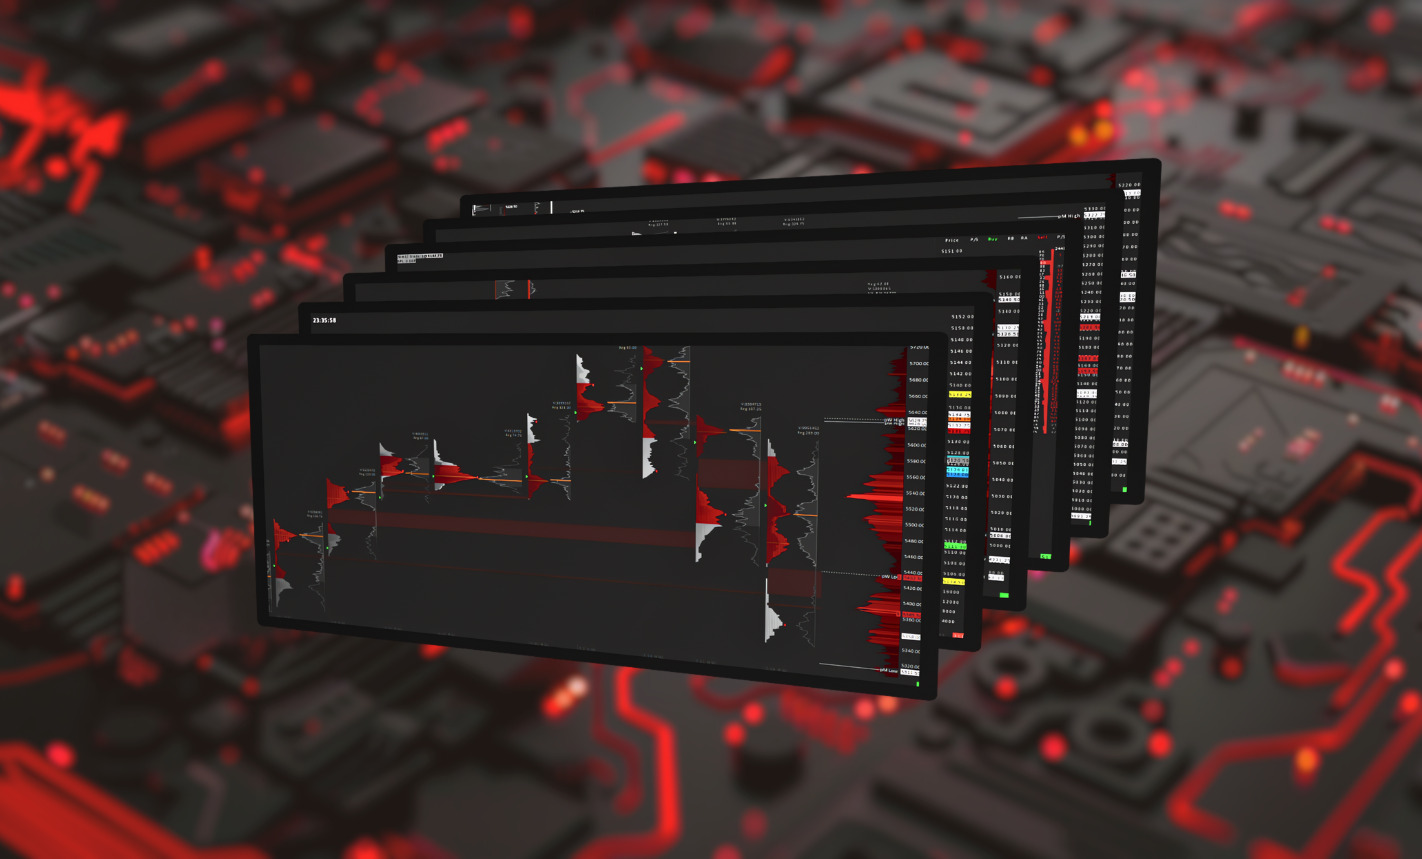
Crimson

Suite

Crimson Suite product featuring five Sierra Chart templates, displayed in a dynamic 3D stack on a softly blurred background, illustrating a complete trading system.

149.99$

What’s Included

Crimson Suite: Bundles five templates into one comprehensive package. Ideal for Day Traders.
Systematic Design: Each component is carefully created, adjusted, and integrated for seamless functionality.
Advanced Trading Setup: Based on auction market theory, enhanced with TPO, Volume Profiling, and Orderflow analysis.
Strategic Framework: Implements a top-down approach for a clear and methodical analysis.
Sierra Chart Weekly TPO Profiles with Volume Profiles, highlighting gaps and single prints.

TPO / Volume Profiles Weekly

Begin with a zoomed-out market perspective for RTH (Retail Trading Hours) on the weekly timeframe. Utilizing TPO and Volume Profiles helps you understand the overall market themes.

Shaded TPO Profiles: Offers a compact view of the market auction process based on time. The darker the shade, the earlier the block was created within the week. The TPO also highlights gaps and weak market structures through the presence of single prints.
Volume Profiles: Provides a compact view of the market auction process based on volume. Ideal for use in conjunction with TPO for a more cohesive analysis of market auctions.
Daily Candlesticks in Sierra Chart displayed with their corresponding Volume Profiles.

Daily Candles with Volume Profiles

We delve deeper into the analysis, yet still focus on the overall market themes. The Daily RTH Chart now provides a closer look at daily activities.

Candlestick Analysis: In addition to Volume Profiling, we are now integrating candlestick analysis into our approach.
Additional Metrics: This includes an ‘Average Daily Range’ graph and Volume Profile metrics such as Range, Volume, and Delta.
Daily retail trading hours Volume Profiles overlaid with 30-minute candles.

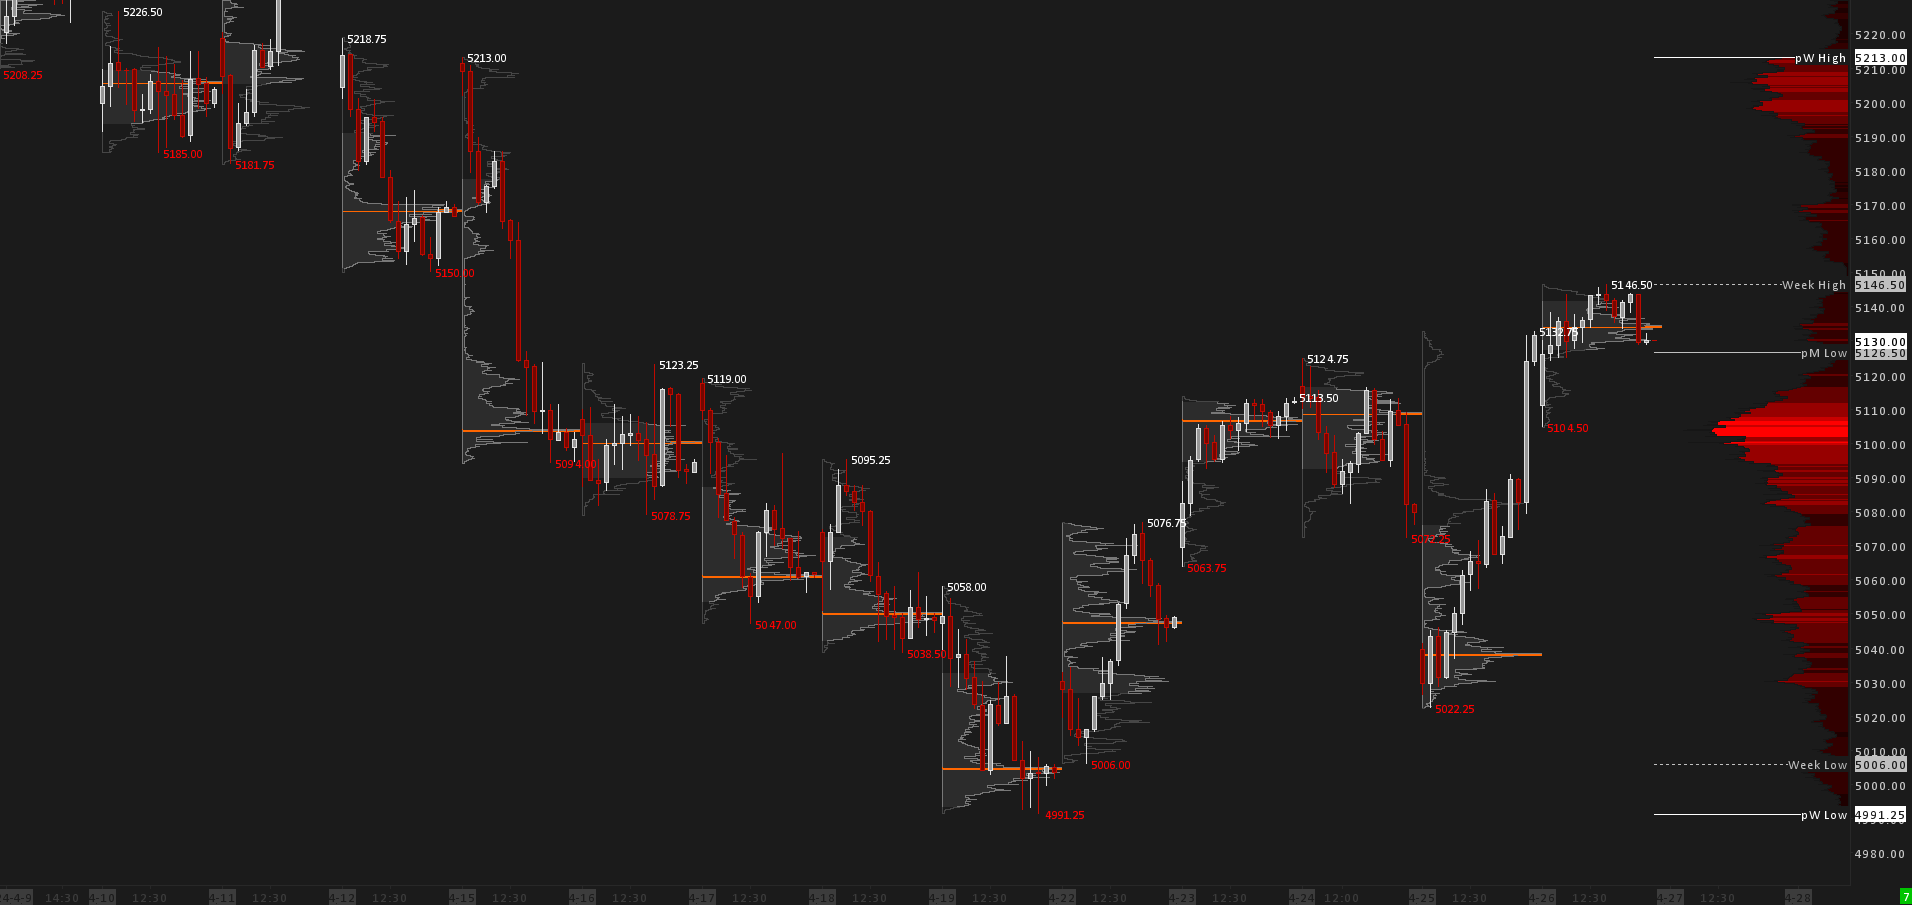
30MIN Candles with Volume Profiles

We take it one step further by examining the Daily RTH activity using 30MIN Candles.

Price Action Analysis: By examining 30MIN Candles, we can analyze Price Action in greater detail. In tandem with Volume Profiling, we now begin to create our ‘price map’ by marking important Support and Resistance levels.
Renko Chart depicting separate Retail Trading Hours and Overnight Sessions in Sierra Chart, marking important day-generated key levels.

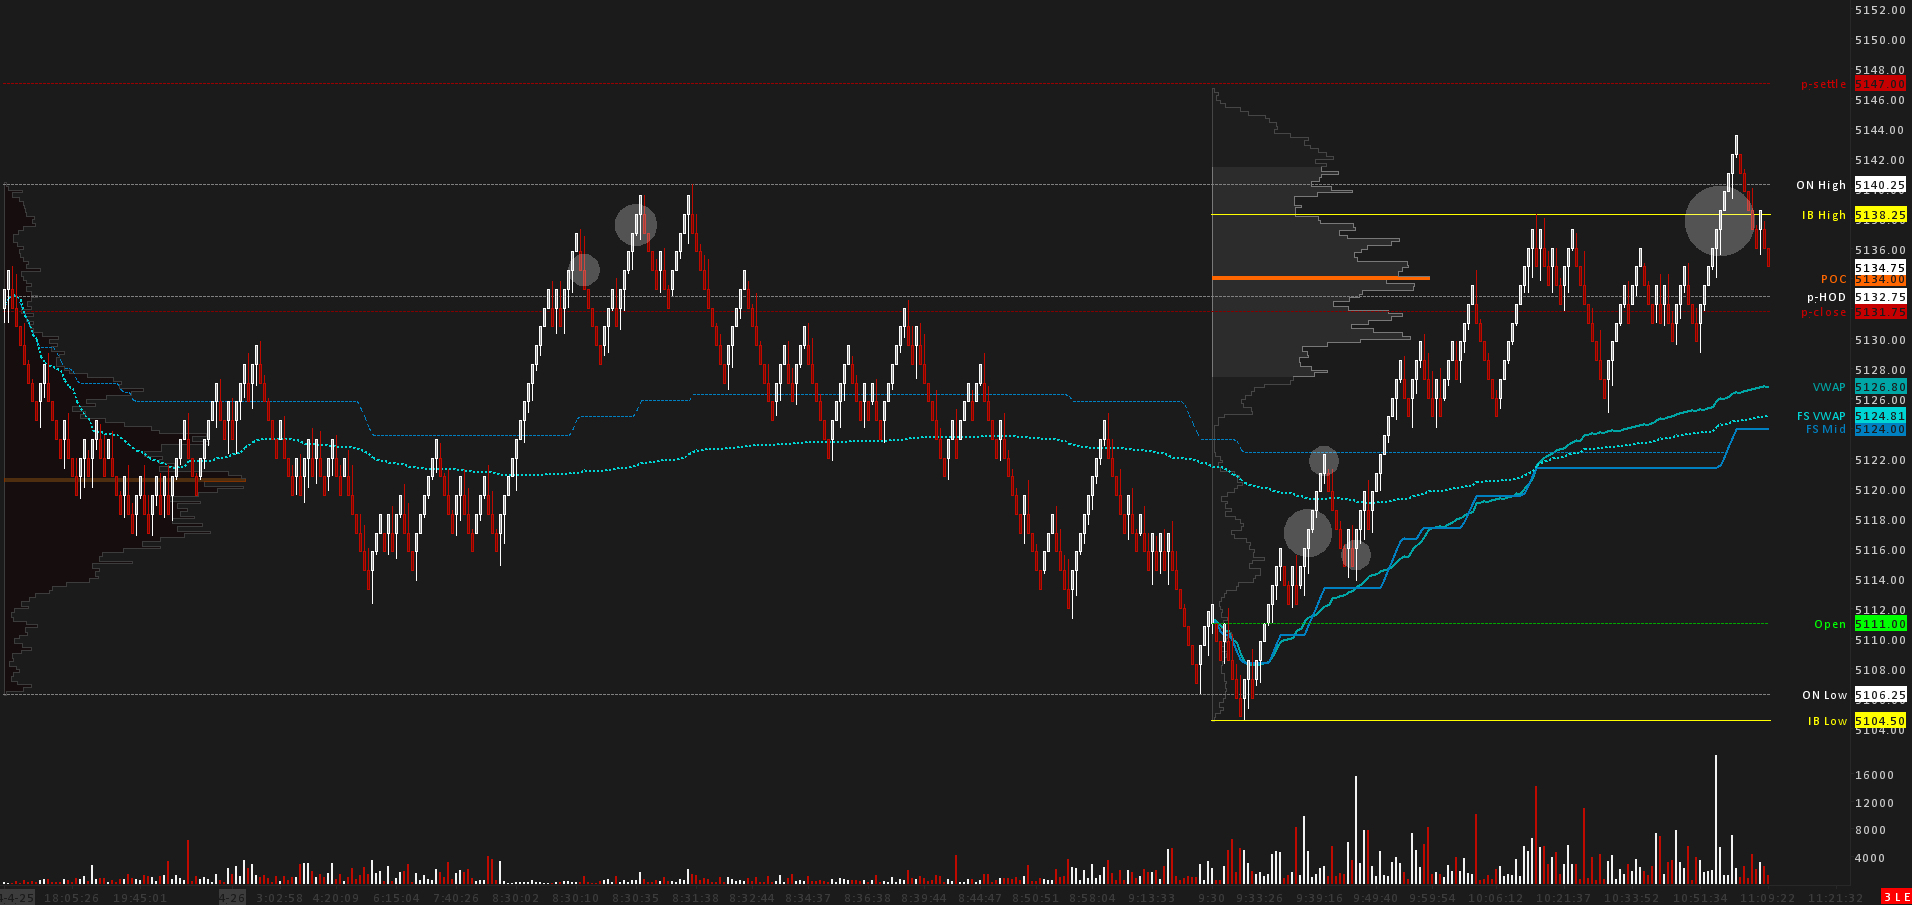
Renko Chart with day generated levels

We now delve deep into the daily action. Therefore, we monitor all important day-generated levels and also take a closer look at the overnight action.
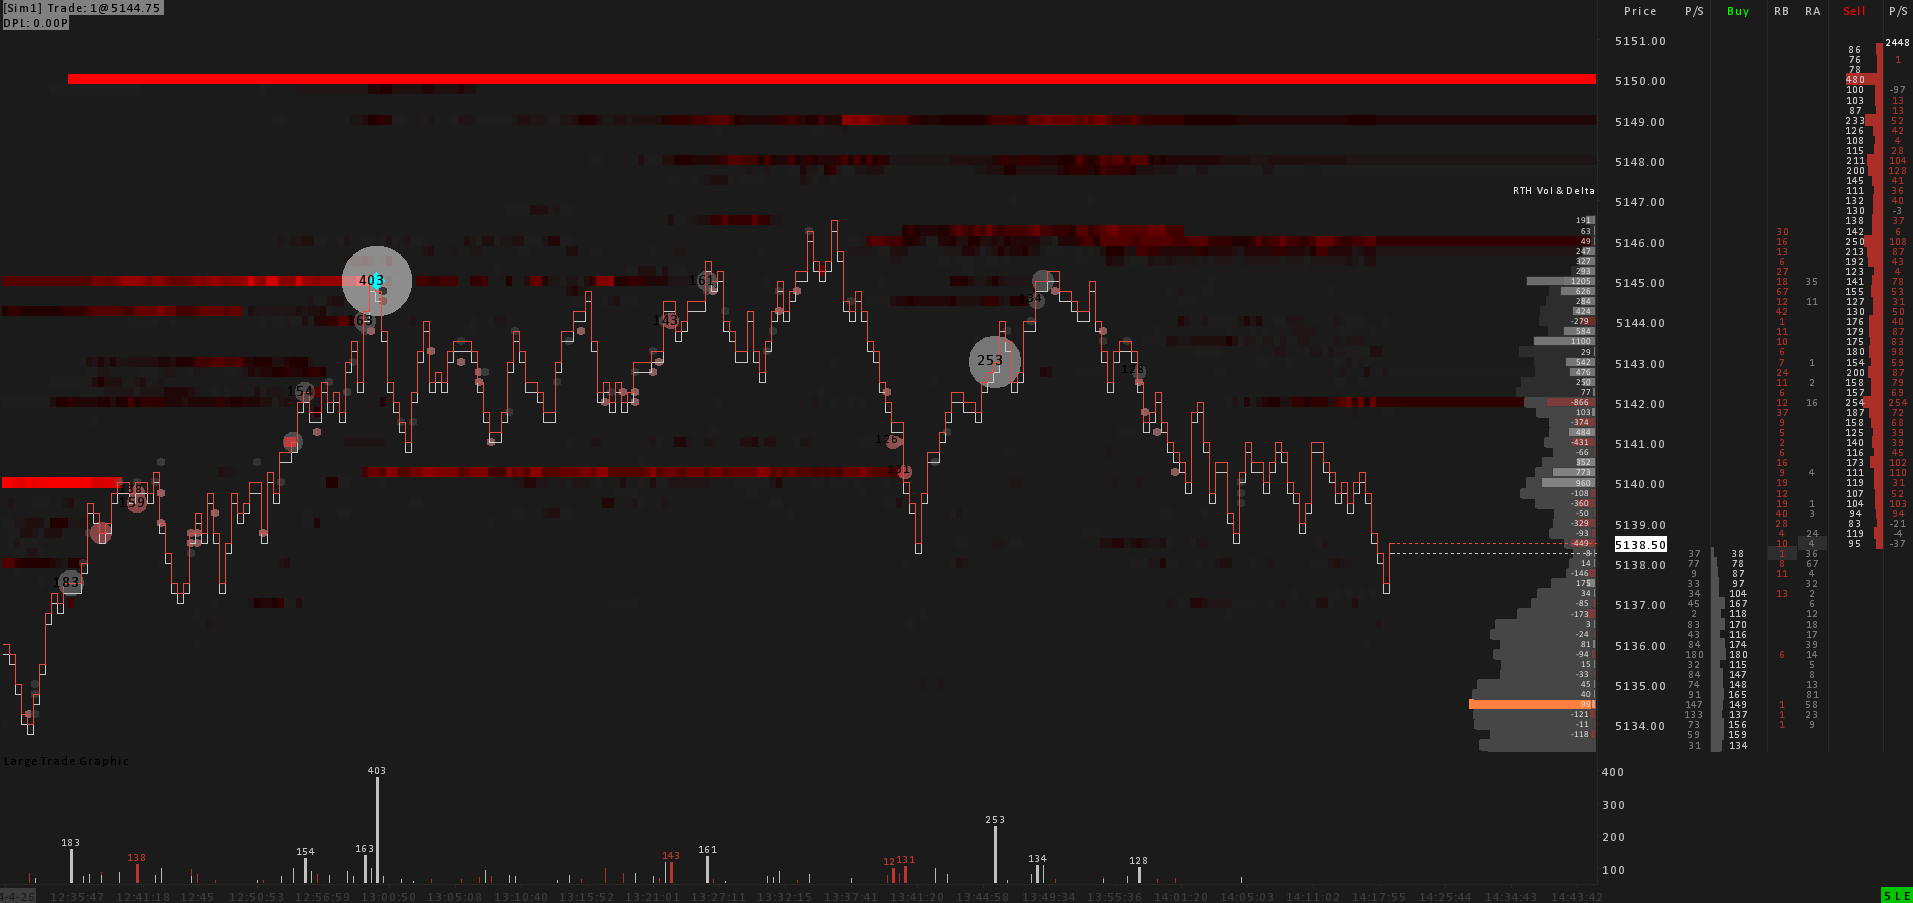
Day-Generated Levels: Automatically marks all important day-generated levels, including Open, previous-close (p-close), p-settlement, previous High of Day (p-High), previous Low of Day (p-Low) (same for previous-Week and previous-Month), Point of Control (POC), Initial Balance High (IB-High), Initial Balance Low (IB-Low), Full Session (FS) VWAP, Regular Hours (RH) VWAP, FS Mid, RH Mid, Overnight High (ON High), and Overnight Low (ON Low).
Overnight and RTH Profiles: To be best prepared for the trading day, we also examine the overnight session, which helps establish our trading bias.
Unstanding the Context: This chart is particularly useful for understanding the context of the trading day. Renko (movement and not time-based) helps us focus on market activity that really matters. Observing price movement and behavior at generated levels is crucial to interpret the market auction process on a daily basis.

Orderflow Trigger Chart

This chart is specifically designed for making precise trading decisions and ‘pulling the trigger’.

Orderflow Tools: Utilizes a Heatmap, custom-coded Large Trade Graphics, an Iceberg Detector, and Volume + Delta Profiles to provide unique insights into market liquidity and potential price movements.
Ready-to-trade DOM: Place your trades inside the fully configured Trade-DOM.

FAQ: Crimson Suite

We recommend Sierra Chart Package 11 or higher to fully utilize all the features within the Suite.

Yes, but the Suite in its default state is optimized for ES futures (S&P 500) currently. If you want to use the Suite for other products, we recommend adjusting session times, scaling, and volume settings to best suit your specific product. Refer to the official Sierra Chart documentation for guidance on making these adjustments.

Scroll to Top