Guide
Support
If you’re new to Sierra Chart, you might find yourself needing a bit of guidance to get everything up and running smoothly. Rest assured, our templates work perfectly fine. However, navigating through a new platform can sometimes be a bit daunting, which is why we’ve put together this support section. Here, you’ll find answers to common questions and solutions to help you get started with Sierra Chart.
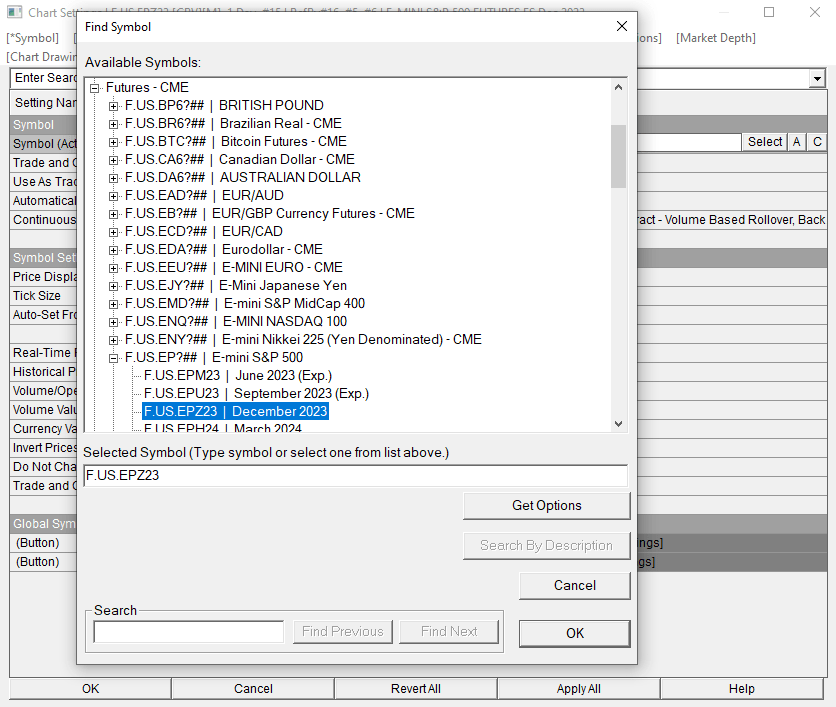
After applying the template, make sure you have added your Data Provider’s Symbol by navigating to Chart > Chart Settings > Symbol > Select Symbol. (For example, we’ve selected the symbol for the most recent S&P 500 mini futures contract in the pictures below.)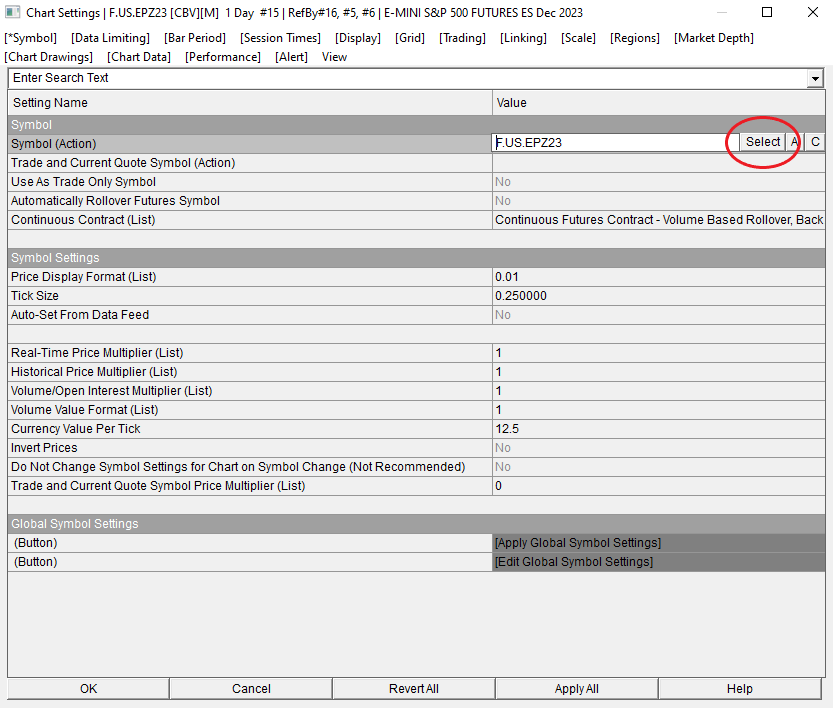
Ensure your price scale is accurate, otherwise, your price bars might be out of view. Refer to external sources to verify the recent prices of your traded product and adjust your scale accordingly. To do so, simply left-click and drag the price column on the right. If the price increments on the scale are too small, right-click the price column and set it to “Interactive Scale Range”. When done adjusting, switch back to “Interactive Scale Move”.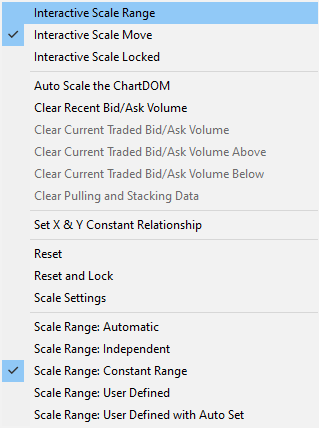
If you have just performed a restart of Sierra Chart, make sure to open the Template .cht file again by navigating to File > Open Chartbook. To make things easier, you can set your template to open automatically with every startup of Sierra Chart. To do this, navigate to Global Settings > General Settings > Startup > Select Files To Open On Startup, and select your template.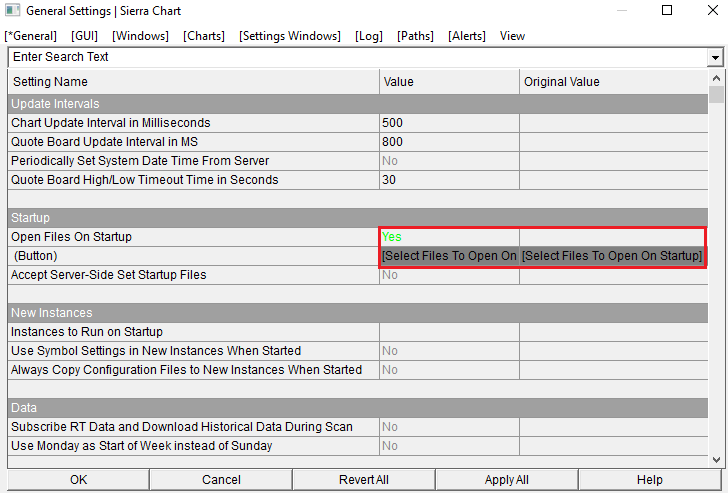
Ensure you have the required Sierra Chart package installed to utilize templates based on advanced features like Volume Profile, Footprint, Orderflow tools, etc. We recommend Sierra Chart Package 11 or higher.
Update to the latest Sierra Chart version. Check here.
This issue occurs because market depth data is recorded and displayed from live data. This means that you will only see market depth data starting from the point in time when you applied the template to your chart. However, if you want to access more accurate data and also view older market depth information, follow the steps below:
Configure Sierra Chart for Tick by Tick data storage: Navigate to Global Settings > Data/Trade Service Settings > Common Settings. Change the Intraday Data Storage Time Unit to 1 Tick.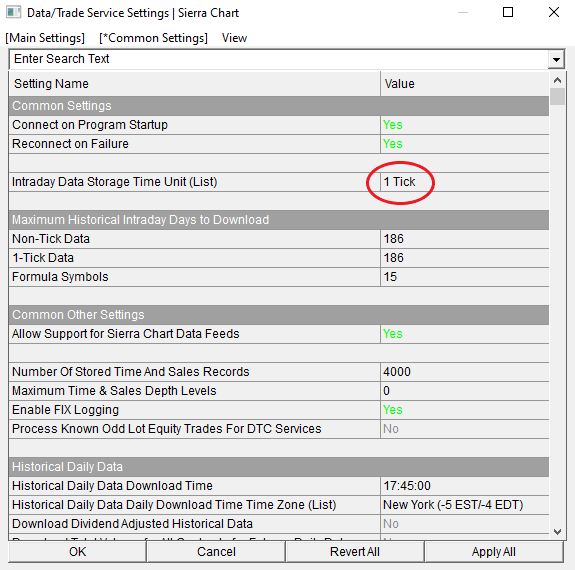
To ensure that your Chart contains complete tick-by-tick data, you should perform a complete data redownload. To do this, navigate to Edit > Delete All Data And Download. This only needs to be done once.
Enable Historical Market Depth Data Download: Go to Global Settings > Sierra Chart Server Settings. Set the Support Downloading Historical Market Depth Data option to Yes.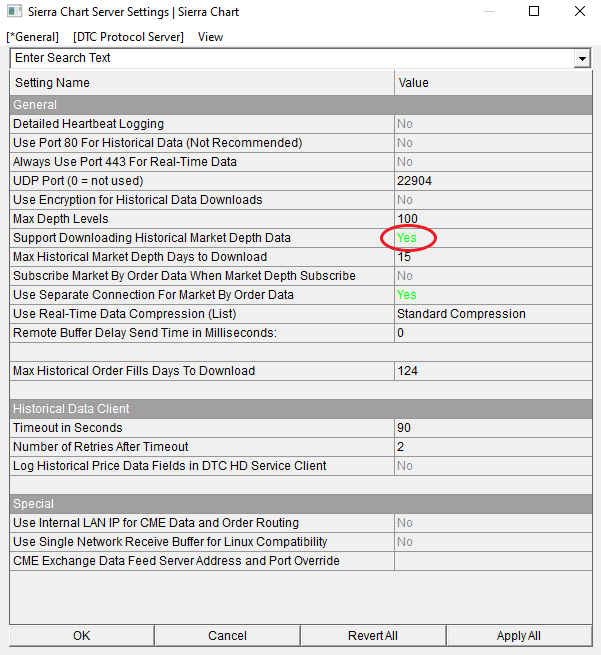
Customize Chart Shortcut Menu for Easy Access: Select Global Settings > Customize Chart Shortcut Menu. Add Download Depth Data from Date-Time. Right-click your chart at the point in time where you want the market depth data download to start, and select Download Depth Data from Date-Time.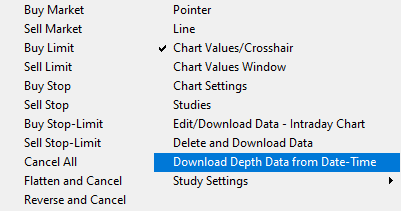
Perform a Restart of Sierra Chart. Make sure you accept Save all? when closing.
Configure Sierra Chart for Tick by Tick data storage: Navigate to Global Settings > Data/Trade Service Settings > Common Settings. Change the Intraday Data Storage Time Unit to 1 Tick.
To ensure that your Chart contains complete tick-by-tick data, you should perform a complete data redownload. To do this, navigate to Edit > Delete All Data And Download. This only needs to be done once.
Your Global Graphics Settings override the Template Graphics Settings. Adjust by navigating to Global Settings > Graphics Settings - Global > Other and uncheck Color Candlestick High-Low Using the Outline Colors.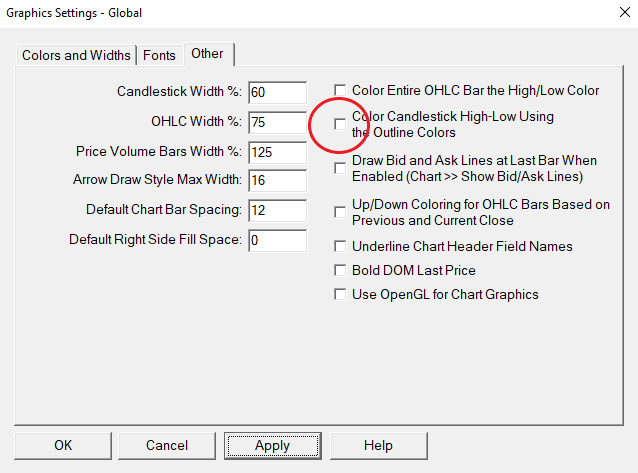
Your Global Tool Settings override the Template Settings. Adjust by navigating to Global Settings > Tool Settings and select Global Chart Drawing Font. Adjust to your preferred font and size.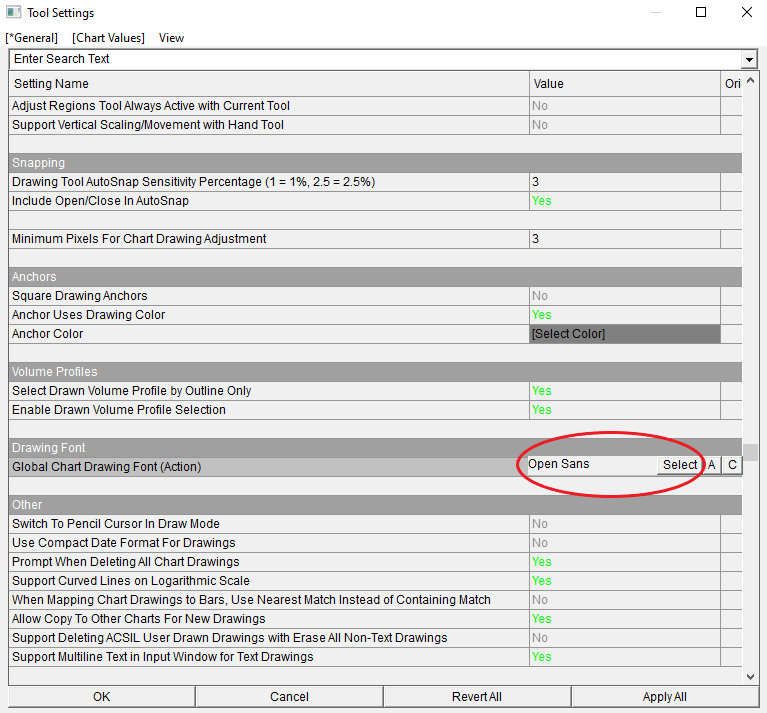
Look into our Speed & Performance Guide for immediate improvement.