OverviewStatistically expected price ranges.
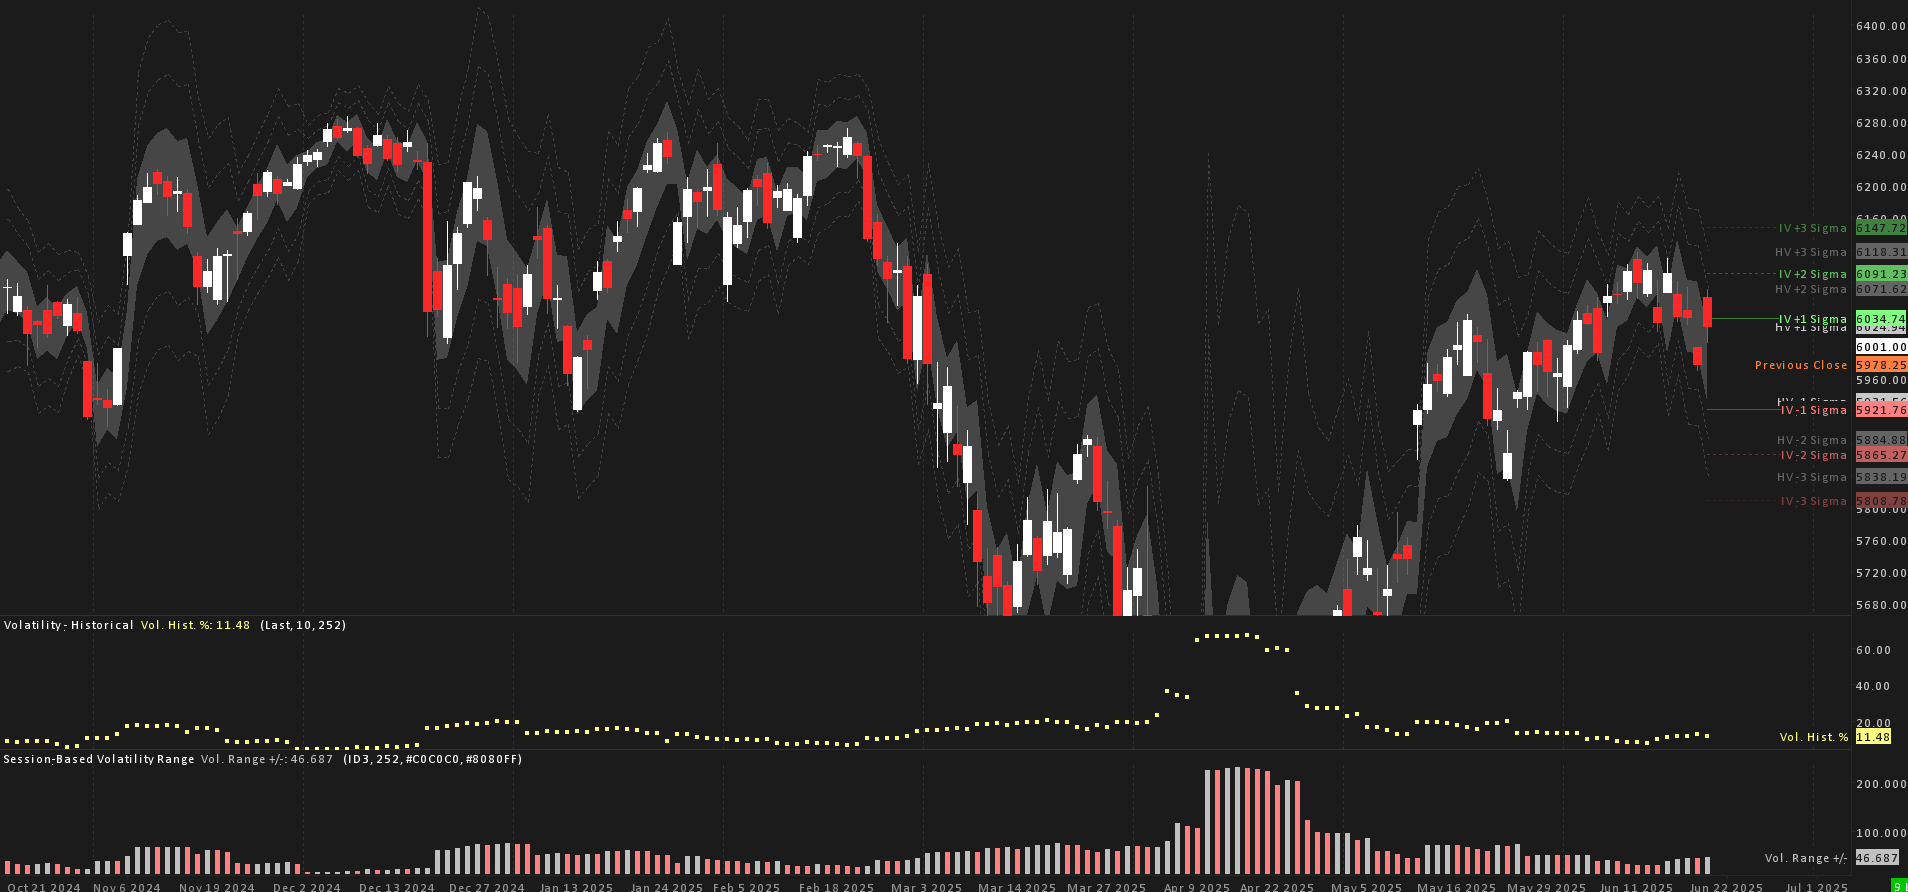
This custom Sierra Chart study provides a volatility-based framework to project
expected price movement using ±1σ, ±2σ and ±3σ ranges. The levels
are calculated from either Historical Volatility (HV) or Implied Volatility (IV) and plotted directly
on the chart, giving you a clear, quantitative reference for where price is statistically expected to
remain.
It alerts when price breaches the ±1σ levels and tracks how often price
closes inside the ±1σ HV range, so you carry a containment statistic for backtesting and
probability modeling.
Volatility modesHistorical or implied.
01Historical Volatility Mode (HV)
Translates HV % values from Sierra Chart's built-in “Volatility - Historical” study into
projected price ranges.
- References Sierra Chart's built-in Volatility - Historical study.
- Projects price ranges based on annualized HV.
- Alerts on HV ±1σ breaches.
- Tracks the % of bars historically closing inside HV ±1σ (analytics output).
02Implied Volatility Mode (IV)
Accepts a manual IV % input to overlay sigma-level forecasts from externally sourced Implied
Volatility, useful for traders pulling IV from options chains.
- Manual IV % input.
- Uses the same sigma logic for projecting IV-based ranges.
- Plots separate overlays for IV projections.
- Alerting support for IV ±1σ crossings.
The formulaHow the sigma ranges are built.
The same sigma projection formula is applied independently for both HV and IV:
±σ range = Previous Close ± (Volatility × √(ForecastBars / BarsPerYear)) × Price
- Volatility is either HV or IV.
- ForecastBars is the user-defined horizon (1 bar = a 1-day projection).
- BarsPerYear reflects the trading calendar (252 for daily charts).
- PreviousClose is the close of the previous bar.
This yields statistically scaled ±1σ, ±2σ and ±3σ
price boundaries around the previous close.
How to useRead the guardrails.
-
±1σ ≈ 68% containment. Under normal-distribution assumptions, about 68%
of closes stay within ±1σ.
-
Not a mean-reversion signal. Price will not necessarily revert when it touches a sigma
level. Treat the boundaries as probabilistic guardrails: crossing them stacks the odds against
further expansion unless confirmed by context.
-
Manage risk and exits. Use the sigma levels to scale out, manage risk, or confirm
potential exhaustion, especially with no high-impact catalysts in play.
-
Use with market context. Strongest in confluence with order flow, volume clusters,
market structure, or known catalysts like news and reports.
-
Backtesting analytics. The built-in analytics summary calculates how often price closed
inside ±1σ historically, useful for backtesting and probability modeling.
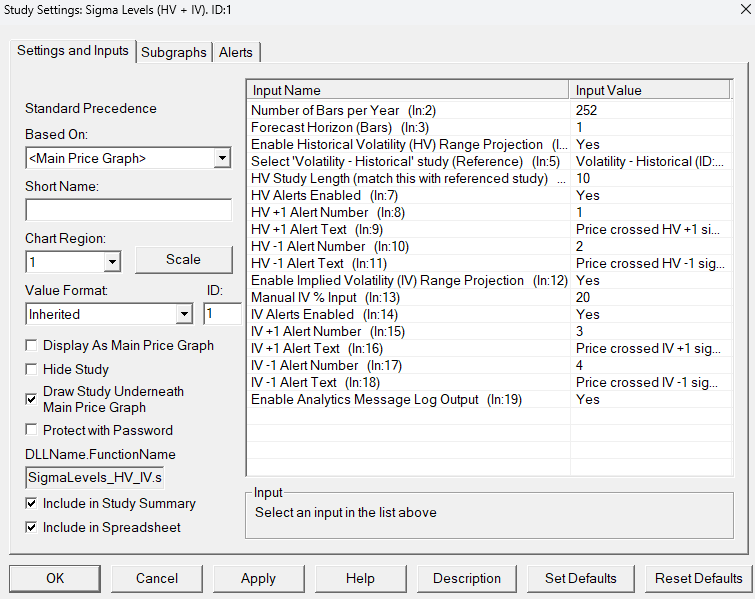
Every element configurableStudy settings
Good to knowFAQ.
How do I get access after subscribing?
At checkout you provide your Sierra Chart Account Name (Help → About →
Account Name / Username). Within 24 hours we add you to the list of users authorized to use the
study. Restart Sierra Chart and open the automatically downloaded chartbook.
Is there a free trial?
Yes - both subscription plans (monthly and annual) start with a 7-day free trial:
you won't be charged until the trial ends, and you can cancel anytime before then. The lifetime
plan is a one-time purchase, so there's no trial.
Can I use the indicator on all symbols?
Yes. Just be sure to adjust the session times when switching to other symbols.