Your cart is empty.
No products in the cart.
Ready-made Sierra Chart volume profile templates with daily, weekly and session profiles. See where volume actually traded and find the HVNs, LVNs and Value Areas that matter.
New to volume profiles? Read the guide

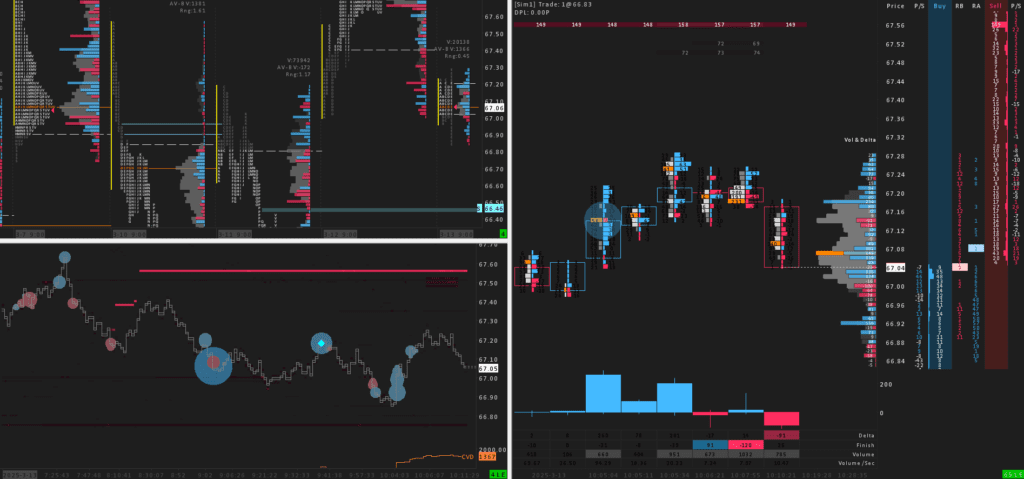


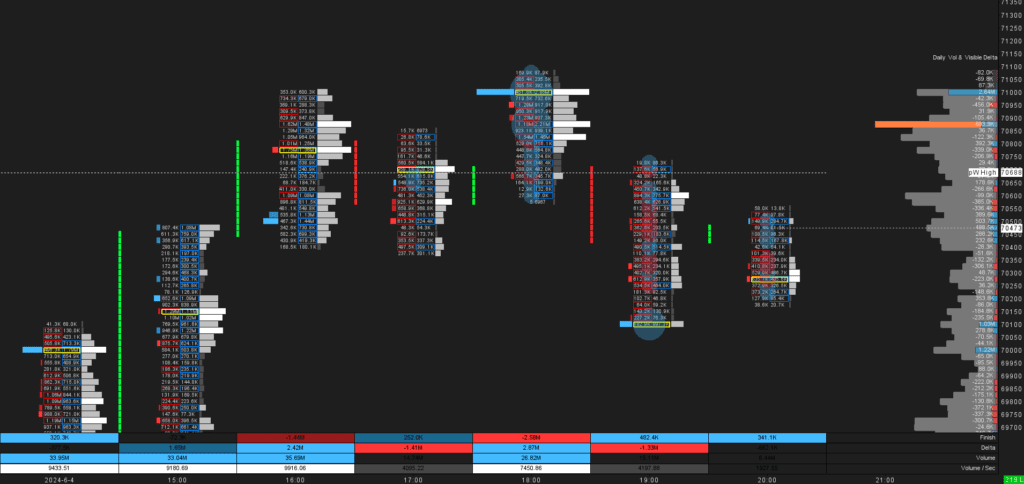


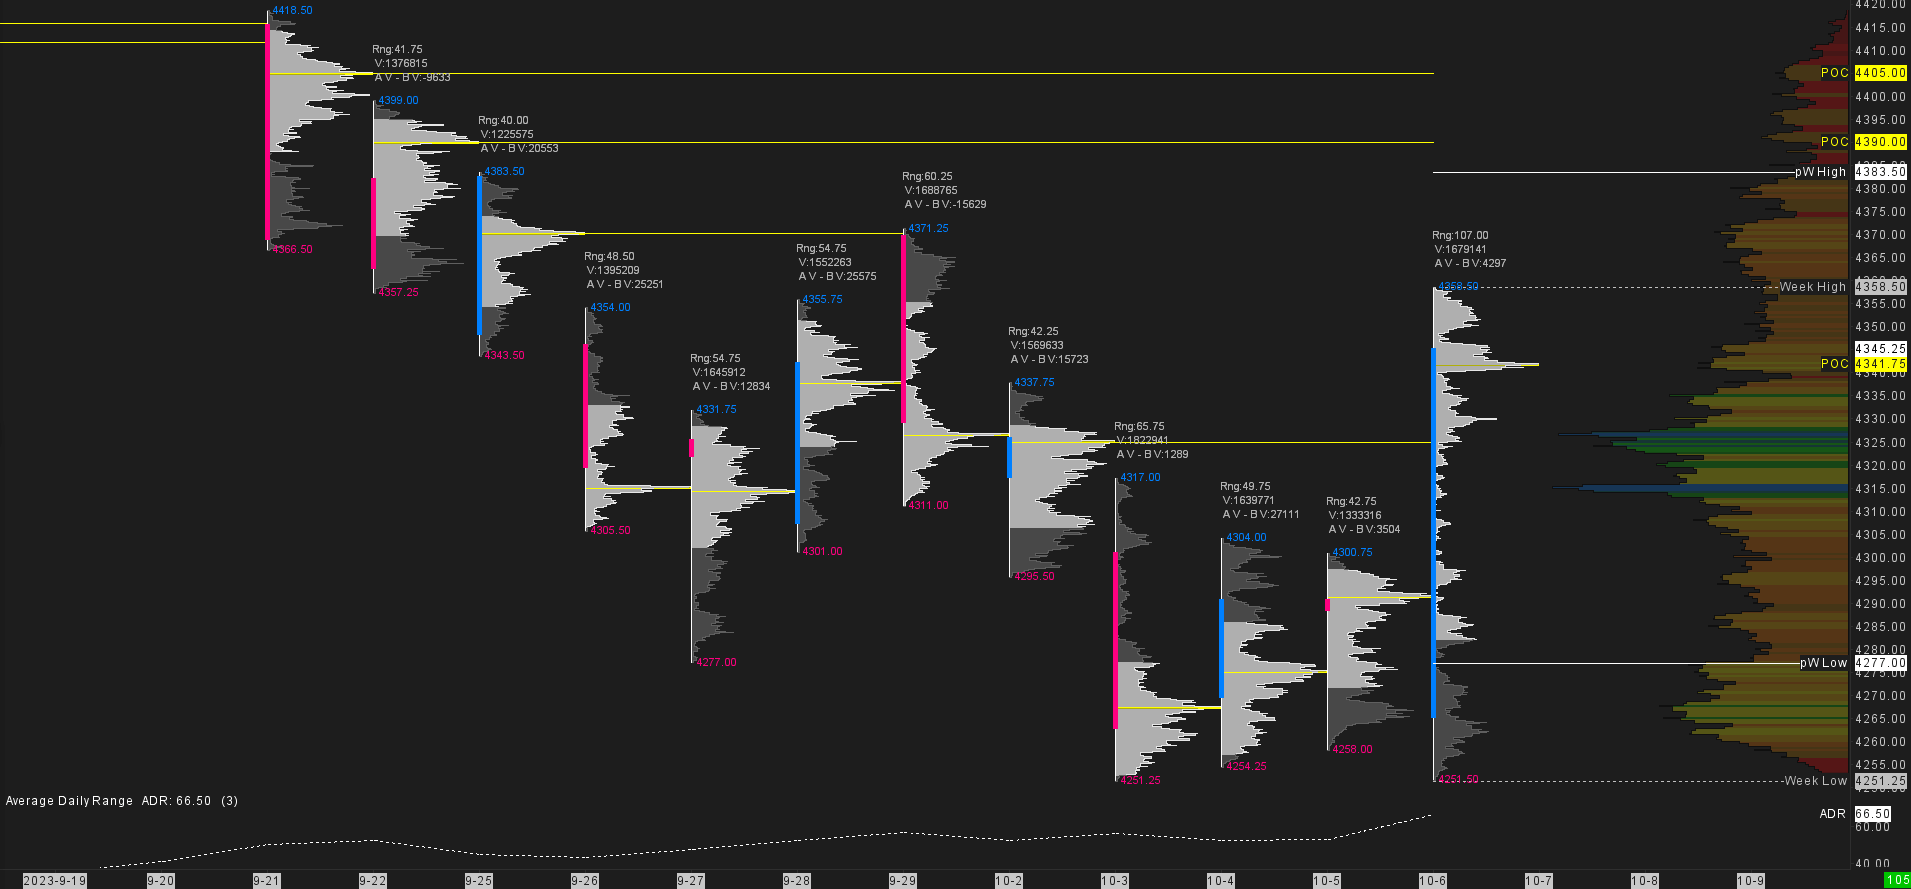


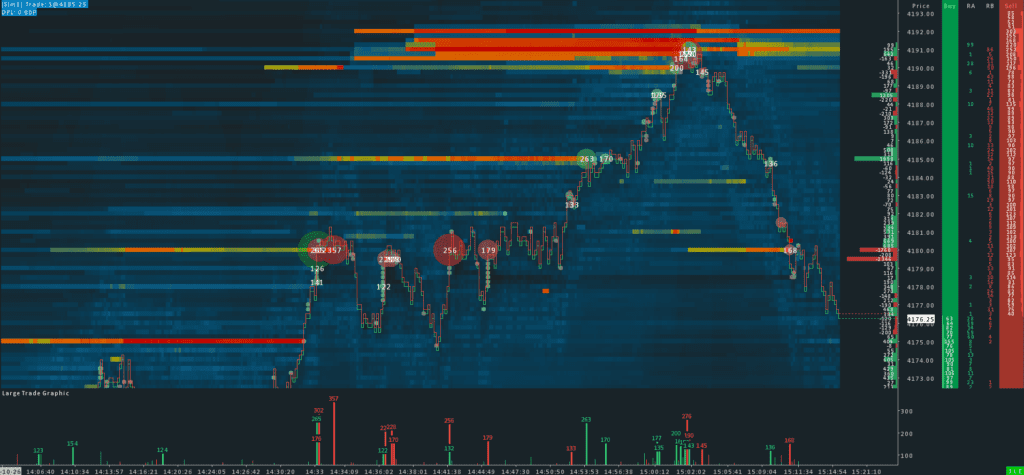


A normal chart shows you where price went and when. A volume profile shows where the business was done. It turns the volume sideways and draws a bar at every price: the longer the bar, the more contracts traded there. In Sierra Chart the study is called Volume by Price.
The market is an auction. Its job is to bring buyers and sellers together and do business. Where both sides agree on price, volume builds up. Where one side is missing, price moves on quickly and leaves little volume behind. The volume profile makes that auction visible.
The Value Area is the price range where most of the volume traded, usually 70% of it. Its upper edge is the Value Area High (VAH) and its lower edge the Value Area Low (VAL). It shows where the market found fair value in that session.
Comparing the Value Areas of several days tells you what the market is doing. When several days in a row share a similar Value Area, the market is balancing and the edges of that area are where trades tend to set up. When a new day builds value outside the old range, the market is trending. As long as it keeps trending, the Value Areas and even the highs and lows of prior days get rejected. When the market breaks back into yesterday's Value Area, that usually comes with a retest of yesterday's POC.
A classic volume profile shows how much traded at each price. A delta profile shows who was aggressive there: the volume bought at the ask minus the volume sold at the bid. Positive delta means aggressive buyers were in control at that price. Negative delta means aggressive sellers were.
Several of our templates overlay the delta on the volume profile, so you read both in one place: how much business was done at a price and which side pushed it.
A profile is only as useful as the time it covers, so every template is set up for a specific session:
The templates are preset for the session times of the market they are made for. On another market, match the session times to your instrument and the profiles work the same way.
ES Renko Chart with day-generated Levels shows separate overnight and RTH profiles together with every important level of the day, drawn automatically.
Bitcoin 30MIN with Daily Volume Profiles: daily profiles with Value Area and POC, a composite profile and cumulative delta on the 30-minute BTC chart.
The Crimson Day Trading Suite combines the weekly, daily, 30-minute and overnight profiles into one top-down workflow, for ES, NQ, Crude Oil and Gold.
Volume by Price is a standard Sierra Chart study. For the pure volume profile templates we recommend Sierra Chart Package 10 or higher. Templates that combine the profile with TPO, a footprint or market depth need Package 11.
A volume profile counts the contracts traded at each price. A TPO (Market Profile) counts the time price spent there. Our weekly templates show both side by side.
Most templates are preset for ES. Several come with optimizations for NQ, Crude Oil and Gold, which you choose on the product page. The session-based profile templates work on any market once the session times match your instrument.
After checkout you download the template and import it into Sierra Chart. The steps are explained in our installation guide.