Your cart is empty.
No products in the cart.
Ready-made Sierra Chart footprint (Numbers Bars) templates for ES, NQ, Crude Oil, Gold and Bitcoin. See delta and volume inside every bar and spot absorption and big players at a glance.
New to footprint charts? Read the guide
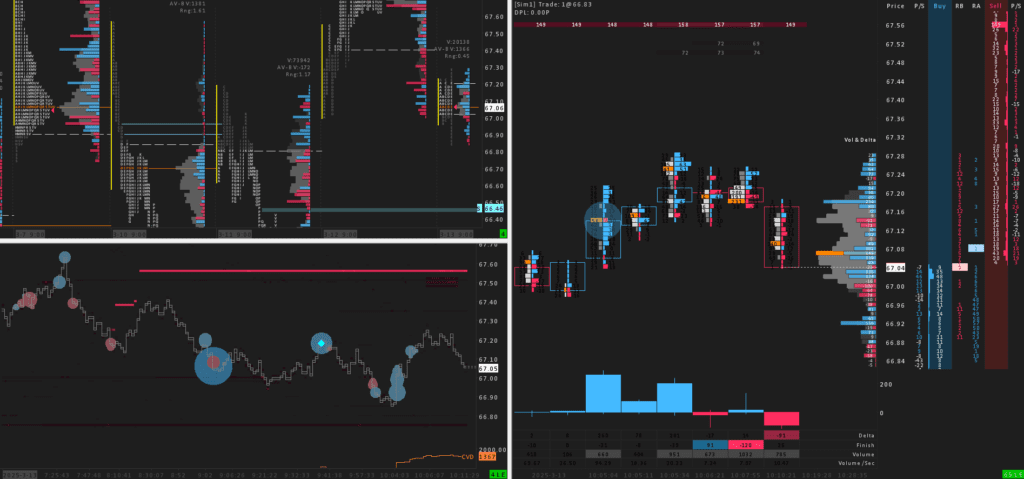


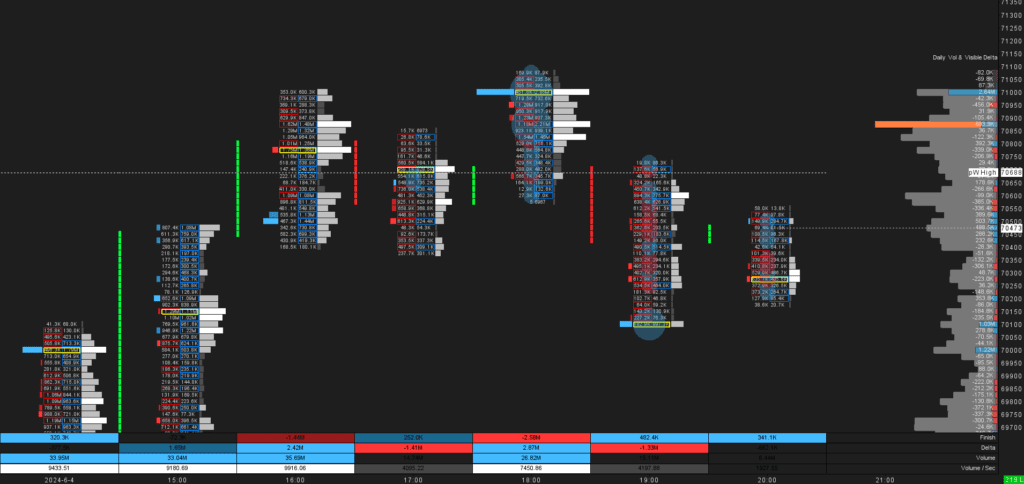


A normal candle tells you where price opened, closed and how far it traveled. A footprint chart opens the candle up. It shows how much volume traded at every price inside the bar and whether that volume came from buyers or sellers. In Sierra Chart the footprint is called Numbers Bars.
The footprint shows the total volume at each price. Next to it, delta also plays an important role: the volume bought at the ask minus the volume sold at the bid. Positive delta means aggressive buyers were in control at that price. Negative delta means aggressive sellers were. Together you see how much traded and who was aggressive.
We offer numerous footprint variations, each with its own layout and focus. These are the main concepts they are built around:
The candle bodies in our footprints are transparent on purpose. That keeps the focus on what happens inside each bar instead of the candle shape.
Footprint 5MIN Delta and Volume is the easiest way in. It uses classic 5-minute bars, so it lines up with the charts you already know. Delta and volume sit side by side in every bar. Available for ES, NQ, Crude Oil and Gold.
Want the footprint as part of a full workflow? The Crimson Day Trading Suite bundles six charts from the weekly TPO down to the footprint. The Orderflow Suite with TPO, Footprint, DOM and Heatmap combines three charts for pulling the trigger.
On a time-based chart, a 5-minute bar during lunch and a 5-minute bar after a news release look the same, even though one had far more trading. Range bars only print a new bar when price has moved a fixed distance. A dull session without any movement does not fill your screen with hundreds of bars, so you only see what really happened.
Time-based bars have their own advantage: every bar covers the same time, so a bar with twice the volume really had twice the activity. In the end it is mostly a matter of preference. New traders commonly start with time-based charts, while quite a few experienced traders have switched to range bars.
Numbers Bars are an Advanced Sierra Chart feature. For the footprint templates we recommend Sierra Chart Package 11. Templates with a DOM or resting-order highlight also read live market depth, so your data feed needs market depth data.
Yes. Footprint is the common name. Sierra Chart calls the study Numbers Bars.
Most templates are preset for ES. Several come with optimizations for NQ, Crude Oil and Gold, which you choose on the product page. The Bitcoin templates are made for Bitcoin. For other markets you adjust the bar size and the volume filters.
After checkout you download the template and import it into Sierra Chart. The steps are explained in our installation guide.