Your cart is empty.
No products in the cart.
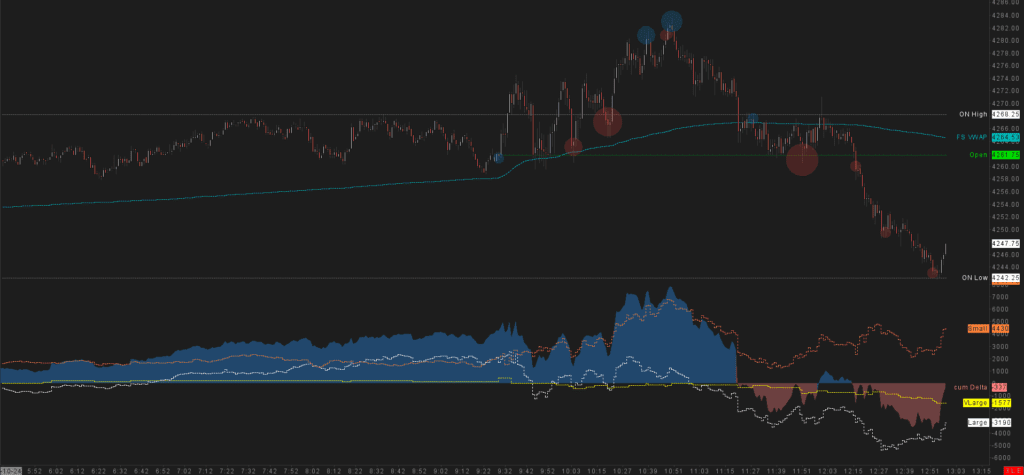
FT71 Cumulative Delta filtered by Lot Size is a Sierra Chart template for detailed cumulative delta analysis, preset for ES (E-mini S&P 500 futures). Instead of one delta line for the whole market, it splits cumulative delta by trade size. You see which participants engage in which direction: the small traders, the large ones or the very large ones.
A normal cumulative delta mixes everyone together. Here every group gets its own line, so you see whether the large and very large traders push in the same direction as the small ones or against them. Divergences between large sellers and small sellers often indicate a shift in market direction.
Because the delta resets at the start of each trading day, every session starts from zero and you read today’s participation on its own.