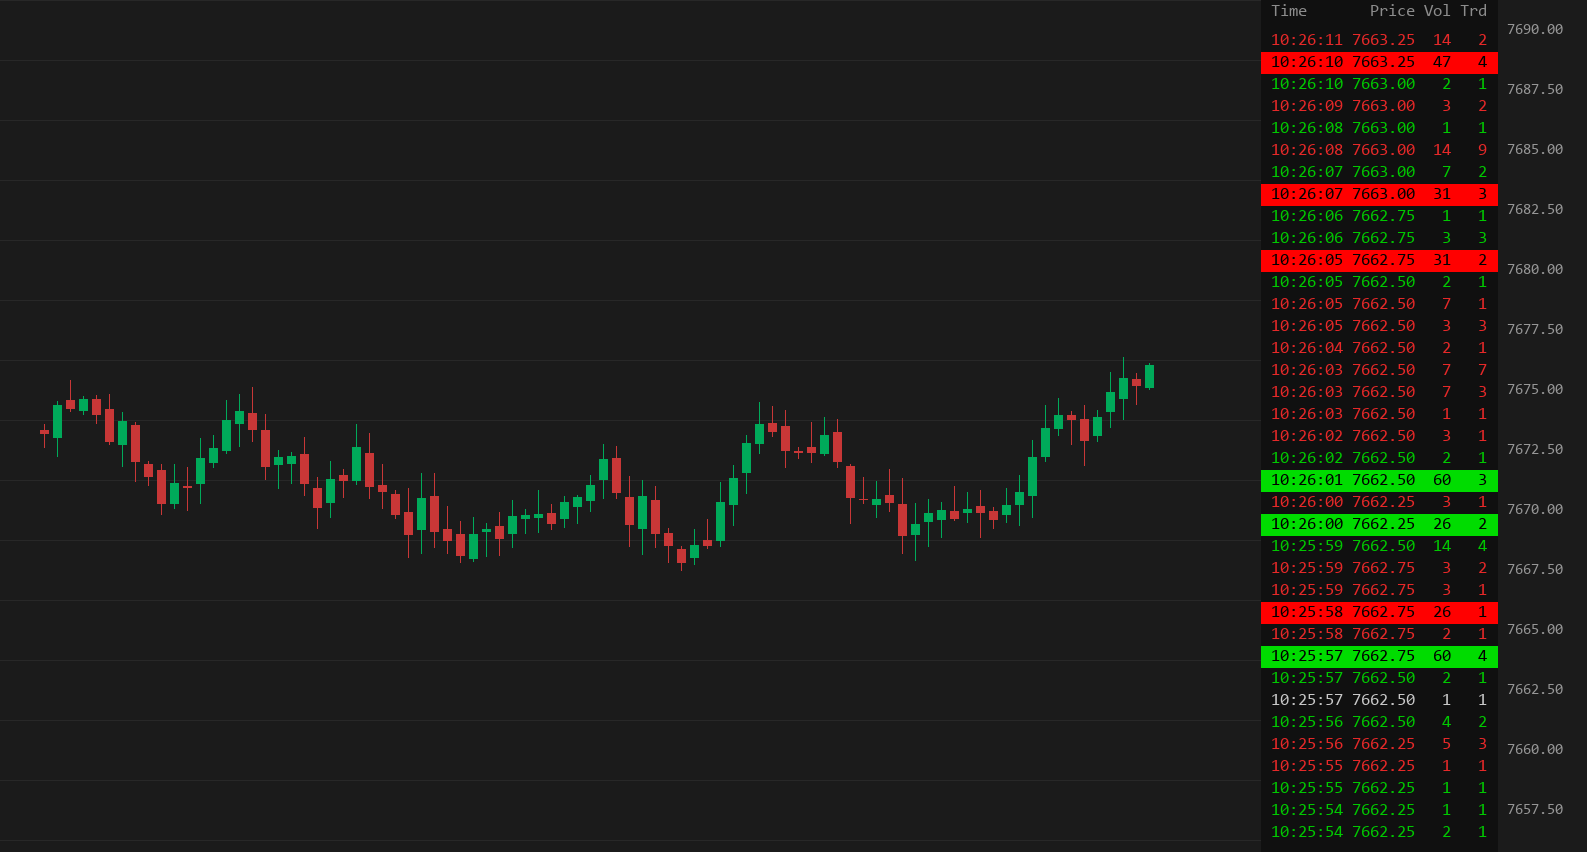
OverviewThe tape and chart in one region
The native Time and Sales window needs its own screen space and sits next to the
chart. Tape On Chart paints the same tape inside the price chart, top left or top right, so the
prints and the bars are in one region and one line of sight.
The study reads the same feed as the window and shows one row per order, with the
number of fills next to the size. Prints above a volume threshold get the side-aware background
highlight known from the window. The study is saved in the chartbook like any other study and
follows the chart's symbol.
Tape rowsColumns
- Trd the number of fills the exchange reported for the order, the native window's Num Trades. A 47-lot filled in three parts and a 47-lot filled at once can be told apart.
- Time to the second, millisecond or microsecond. Microseconds show the order in which a burst of fills arrived.
- Highlights two volume tiers, each with its own at-ask and at-bid background, like the native window's volume highlight. Tier one starts at 25 contracts by default.
- Optional columns the side as text, the size displayed at the bid and ask when the trade printed, and the bid and ask prices.
CombiningCombine Records
The feed delivers each fill of an order separately. The Combine Records input decides
whether the study merges them back into the original order, the way the native Time and Sales window
does, or lists every fill.
01Exchange summary trades · default
One row per order, the same result as "Combine into Exchange Reported Original Summary Trade" in
the native Sierra Chart Time and Sales window.
02Same timestamp, price and side
Fills that share one exact exchange timestamp at one price and side become one row. In practice
these are the fills of one order. This mode also works in Chart Replay.
03Same price and side (consecutive prints)
Consecutive prints at one price keep adding to one row, like "Same Price and Type" in the native
window. Useful for watching a level being worked.
04Do not combine
Every fill as the feed delivers it.
The filters follow the native window as well: a minimum and maximum volume per
record before combining, a minimum combined volume after it, trades at the ask only or at the bid
only, and bid/ask quote rows if wanted.
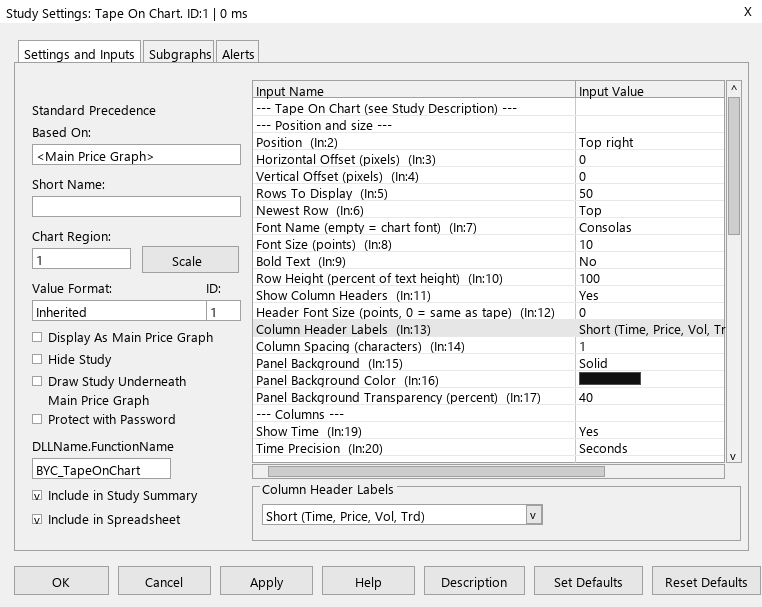
Study inputsSettings
-
Position. Top left or top right, pixel offsets. The panel keeps clear of the price scale
and the Chart DOM.
-
Font. Name, size, bold, row height, and a separate size for the header line.
-
Columns. Time, Price, Volume, Trades, Side, Bid x Ask Size, Bid / Ask Price, each on or
off. Short or full header labels, adjustable column spacing.
-
Background and colors. Solid or no background. Colors for trades at the ask, at the
bid, in between, and for quote rows and headers.
-
Rows. Up to 200. The tape fills from the stored records when the study is added,
rebuilds when a setting changes, and clears on the spacebar.
-
Symbol. The chart's symbol, or any other symbol open in the same Sierra Chart
instance.
-
Chart Replay. The tape resets at replay start and stop and shows only replayed
prints.
Study Settings: Tape On Chart
RequirementsRequirements
- Sierra Chart 2911 or newer. Runs wherever Sierra Chart runs: on a Windows PC (x64 build) and on Windows on ARM, which includes a Mac running Sierra Chart through Parallels (ARM64 build). Both builds are included.
- A data feed with Time and Sales. Any symbol Sierra Chart shows a Time and Sales window for works. The highlight defaults are ES sizes. Set your own for NQ or thinner markets.
- A Chart Update Interval of 100 ms or lower. The panel refreshes at the chart's update interval.
- Lock Fill Space recommended. Leave some fill space to the right of the last bar and lock it (Chart → Lock Fill Space), so the bars stay clear of the panel.
QuestionsFAQ
How do I get access after buying?
At checkout you provide your Sierra Chart Account Name (Help → About →
Account Name / Username). Within 24 hours we add you to the list of users authorized to use the
study. Restart Sierra Chart and open the automatically downloaded chartbook. If the chart data does not start
loading by itself, use Edit → Translate Symbols to Current Service. You can also add the study to any chart yourself: Analysis → Studies → Add Custom Study → Tape On Chart.
Is there a free trial?
Yes, you can try the study free for 7 days. Send your Sierra Chart Account Name
(Help → About → Account Name / Username) to
contact@boostyourcharts.com
and we grant access within 24 hours. No payment needed. After the 7 days the trial ends.
To keep using the study, buy the lifetime license.
Is it the same as the Time and Sales window?
In data and rows, yes. The study reads the trade feed the native window is built from and
combines orders the same way. We checked it row for row against the window on live market data. The
settings live in the study, not in the window, because Sierra Chart does not let a study read
the window's settings. You set columns, combining, filters and highlights once in the study
dialog. The one difference is timing. The window updates per record and the study once per
chart update interval. At 100 ms or lower you will not notice it.
Which markets does it work on?
Any symbol with a Time and Sales feed in Sierra Chart: CME futures, other futures
exchanges, stocks. The highlight sizes default to ES. On other markets you enter your own.
Does it work in Chart Replay?
Yes. A replay carries no order markers, so the native Time and Sales window combines nothing
in a replay. The study gives you a choice through the Combine In Chart Replay input. Choose
Summary view to keep one row per order, grouped by exact timestamp, or choose
Same as the Sierra Chart tape to see every fill uncombined, exactly as the native window
shows it. Live data is never affected by this input.