Your cart is empty.
No products in the cart.
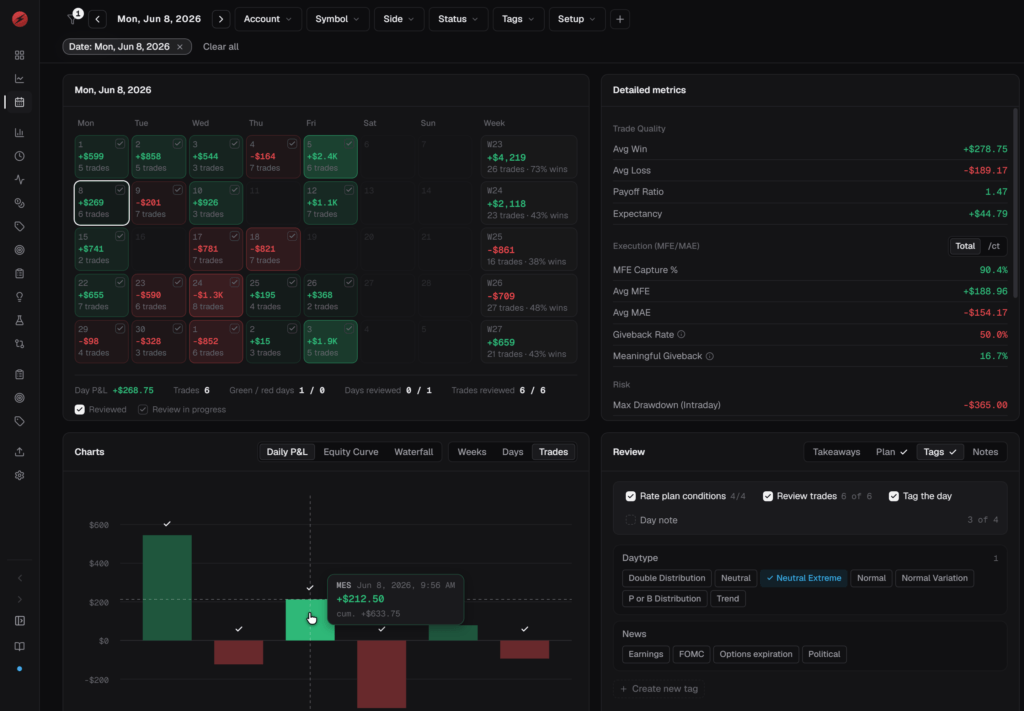
If you trade with Sierra Chart, you have probably spent real time on your charts. The right footprint, a clean TPO profile, a DOM you can read at a glance. Maybe you bought one of our Sierra Chart templates for exactly that reason. Good charts matter. But they are rarely the reason a trading account bleeds.
Most accounts bleed through broken rules. The extra trade after the daily stop. The stop that got moved “just this once”. The size that doubled after two losers. Sierra Chart records every one of those trades in its Trade Activity Log. What it will not tell you is which ones broke your plan, and what that habit has cost you over the last three months.
That is the job of a Sierra Chart journal. In this article we explain why discipline is the biggest lever most traders have, why willpower alone does not hold it, and how we built the boostyourcharts Sierra Chart trading journal around that one idea.
It sounds obvious, almost too obvious to write down. Every trading book tells you to stick to your plan. Yet when we look at our own trading and talk to other traders, the same pattern shows up again and again: the setups are fine, the execution is not.
Here is a simple example with made-up numbers. A trader makes $250 on each of four good days in a week. On the fifth day they hit their daily loss limit at -$400, keep trading to win it back, and finish the day at -$1,400. With the rule, that is a +$600 week. Without it, the week ends at -$400. Nothing about their chart reading changed. One rule did.
In our article on the statistical edge in trading we showed how a backtested pattern gives you an edge. That edge only exists if you trade it the way you tested it: the same entries, the same stop, the same size, every time. A rule you follow 80% of the time is not the rule you backtested. It is a different strategy, and nobody has tested it.
This is why discipline gives you so much leverage. Getting better at reading the market is slow and uncertain. Removing your two most expensive habits is fast, and you can measure it.
Nobody decides at 8am to revenge trade at 2pm. Rules get broken in the moment, under pressure, when a loss stings and the market is moving fast. And afterwards, memory is forgiving. You remember the great trade, not the five small rule breaks that paid for it.
Discipline that lasts needs three things, and willpower is none of them:
A trading journal is where all three come together. The rest of this article walks through each step and shows how it works in the boostyourcharts journal.
A plan is a short list of commitments you make before the open and rate yourself against afterwards. Not a 20-page document. Three to five questions you can answer honestly at the end of the day, for example:
In the journal, a day plan is exactly that: a list of conditions you answer yourself, as a checkbox, a number, a category or a checklist. You link the plan to the day on the Trades page before the session, and you rate it in the same place afterwards. Nothing is scored automatically, and that is on purpose. The journal already knows your P&L. Only you know whether you followed your process.
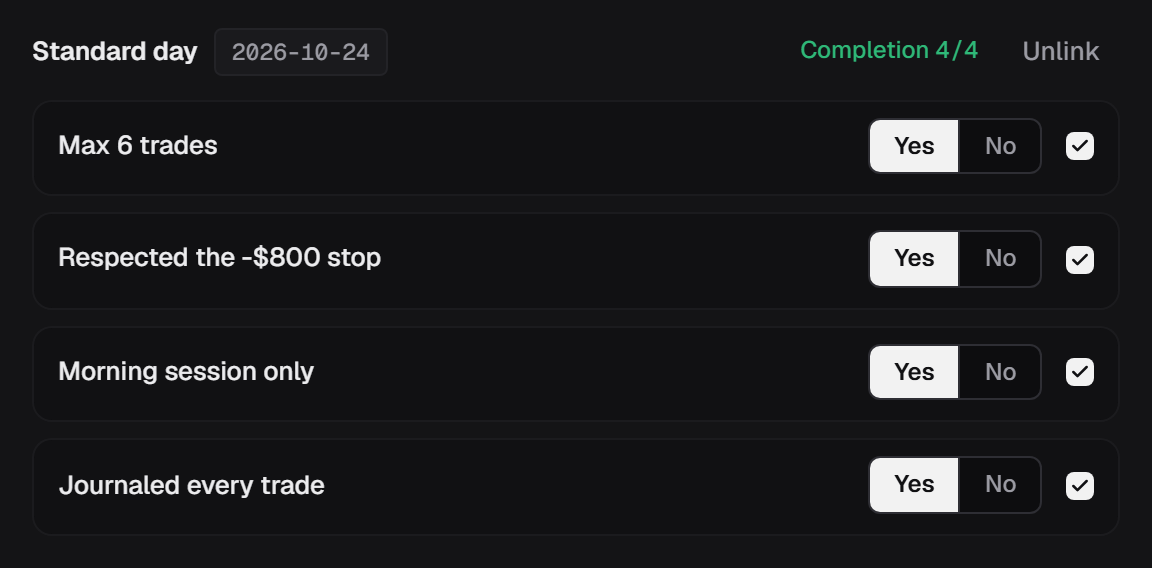
Over time, Plan Analytics shows what your own answers turned out to predict. For example, how your days went when you marked your levels compared to the days you did not. That is usually the moment a rule stops feeling like a chore.
Keep the first version short. Five conditions you rate every day beat fifteen you abandon by Wednesday.
Some rules are mechanical: a daily loss limit, a maximum number of trades, a trading window. For those you want two layers.
Sierra Chart has its own risk controls, and if you trade with a daily loss limit you should use them. Trade Account and Risk Management can reject orders that would increase your position once a daily loss limit is reached, and it can flatten your positions. Global Profit/Loss Management can flatten your positions and lock trading at a profit or loss level you set. Which of them applies depends on your trading service and account, so check Sierra Chart’s documentation for your setup: Trade Account and Risk Management and Global Profit/Loss Management. If you trade a prop firm account, the firm usually enforces its own daily loss limit on top.
A hard stop is your circuit breaker. It protects the account on the worst day. It does not tell you how close you came, how often you broke your softer rules, or what they cost you.
The journal’s guardrails cover the rules you want to hold yourself to. You arm them on the Trades page, and each one gets a small meter in a row called Watched live that fills up as the day goes on. There are twelve rule types:
When a rule is hit, its meter shows it. With the Sierra Chart Bridge connected, the warning also arrives as a Windows notification, so you see it even while Sierra Chart covers the browser.
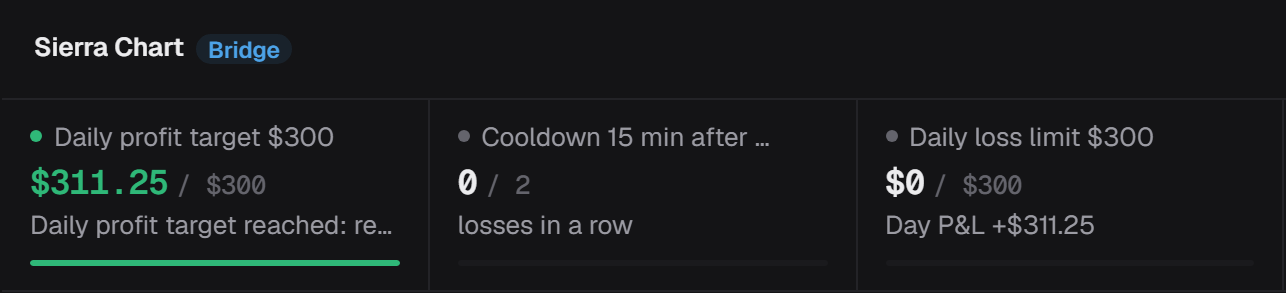
To be clear about what guardrails do: they warn, they never block. Nothing in the journal can stop an order, and the journal never sits between you and your broker. Blocking is Sierra Chart’s job, which is layer 1. The guardrail’s job is to take away the excuse “I didn’t notice”. Also note that the daily P&L rules count closed trades. An open position deep in the red is not in the number until you close it.
This is the step most traders skip, and the one that pays the most.
With the Bridge, the journal’s companion app and Sierra Chart study, every closed trade appears in the journal within seconds of going flat, with a screenshot of your chart at entry and at exit. Without the Bridge, you save the Trade Activity Log and upload it. Either way, you never type a trade by hand. Scale-ins and partial exits are rebuilt into one trade from flat to flat, matched first in, first out, the same way Sierra Chart does it.
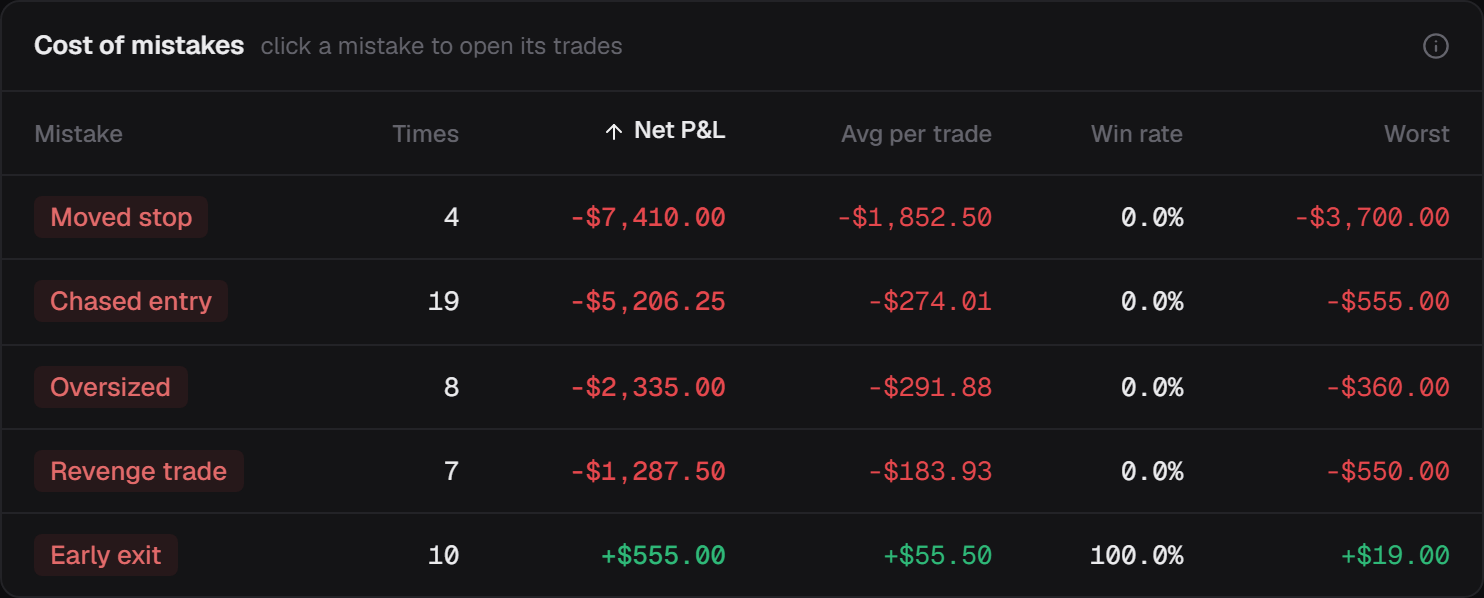
A review means labeling what actually happened. In the journal you tag trades with your own words: your setups, the market context, and above all your mistakes. “Moved stop”. “Chased entry”. “Traded after limit”. “Oversized”.
The Tags page then turns each mistake tag into a dollar figure: what that habit has cost you, and how often you did it. On our demo account, “Moved stop” cost -$7,410 across only 4 trades. Seeing one habit priced like that does more for your discipline than any trading quote ever will. (These are demo account numbers, not a real trader’s results.)
The Review step on the Trades page is a four-item checklist: rate your plan, review every trade (a tag or a setup counts), tag the day, and write a day note. Finish it and the day gets a review mark on the journal calendar. Review coverage shows how many of your trades you actually went back to. It is a simple honesty check, because a journal you only open on good days teaches you nothing.
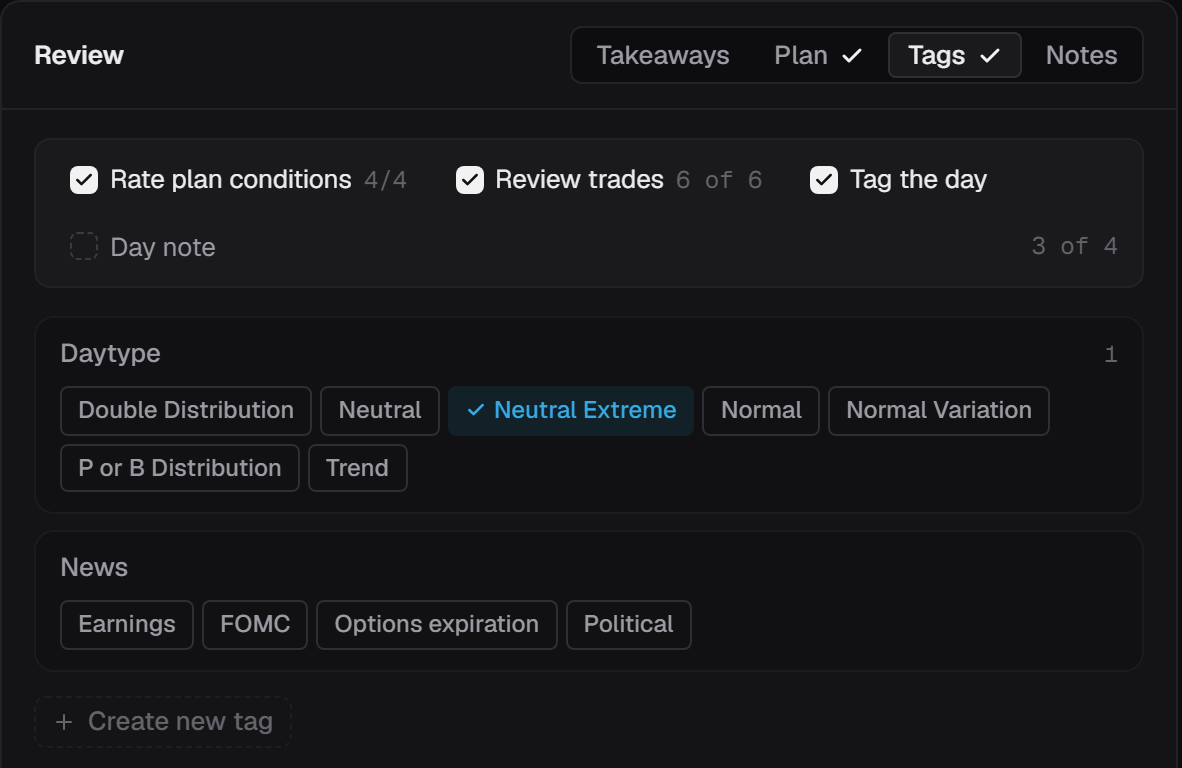
If you only do one thing after reading this: tag your mistakes honestly for two weeks. Not your setups, not your day types. Your mistakes.
Traders resist rules because rules feel like missed opportunities. “If I had stopped after two losses, I would have missed the comeback.” Maybe. The What-If Lab lets you check.
It replays your real trade history as if one rule had been enforced: a daily loss limit, a stop per trade, a trade cap, a trading window, or simply removing every trade with a certain mistake tag. You get a before and after for net P&L, win rate, profit factor and maximum drawdown, and both sides of the trade-off in plain counts. A sensitivity sweep shows the same rule at nearby settings, so you can see whether the result holds up or depends on one lucky number.
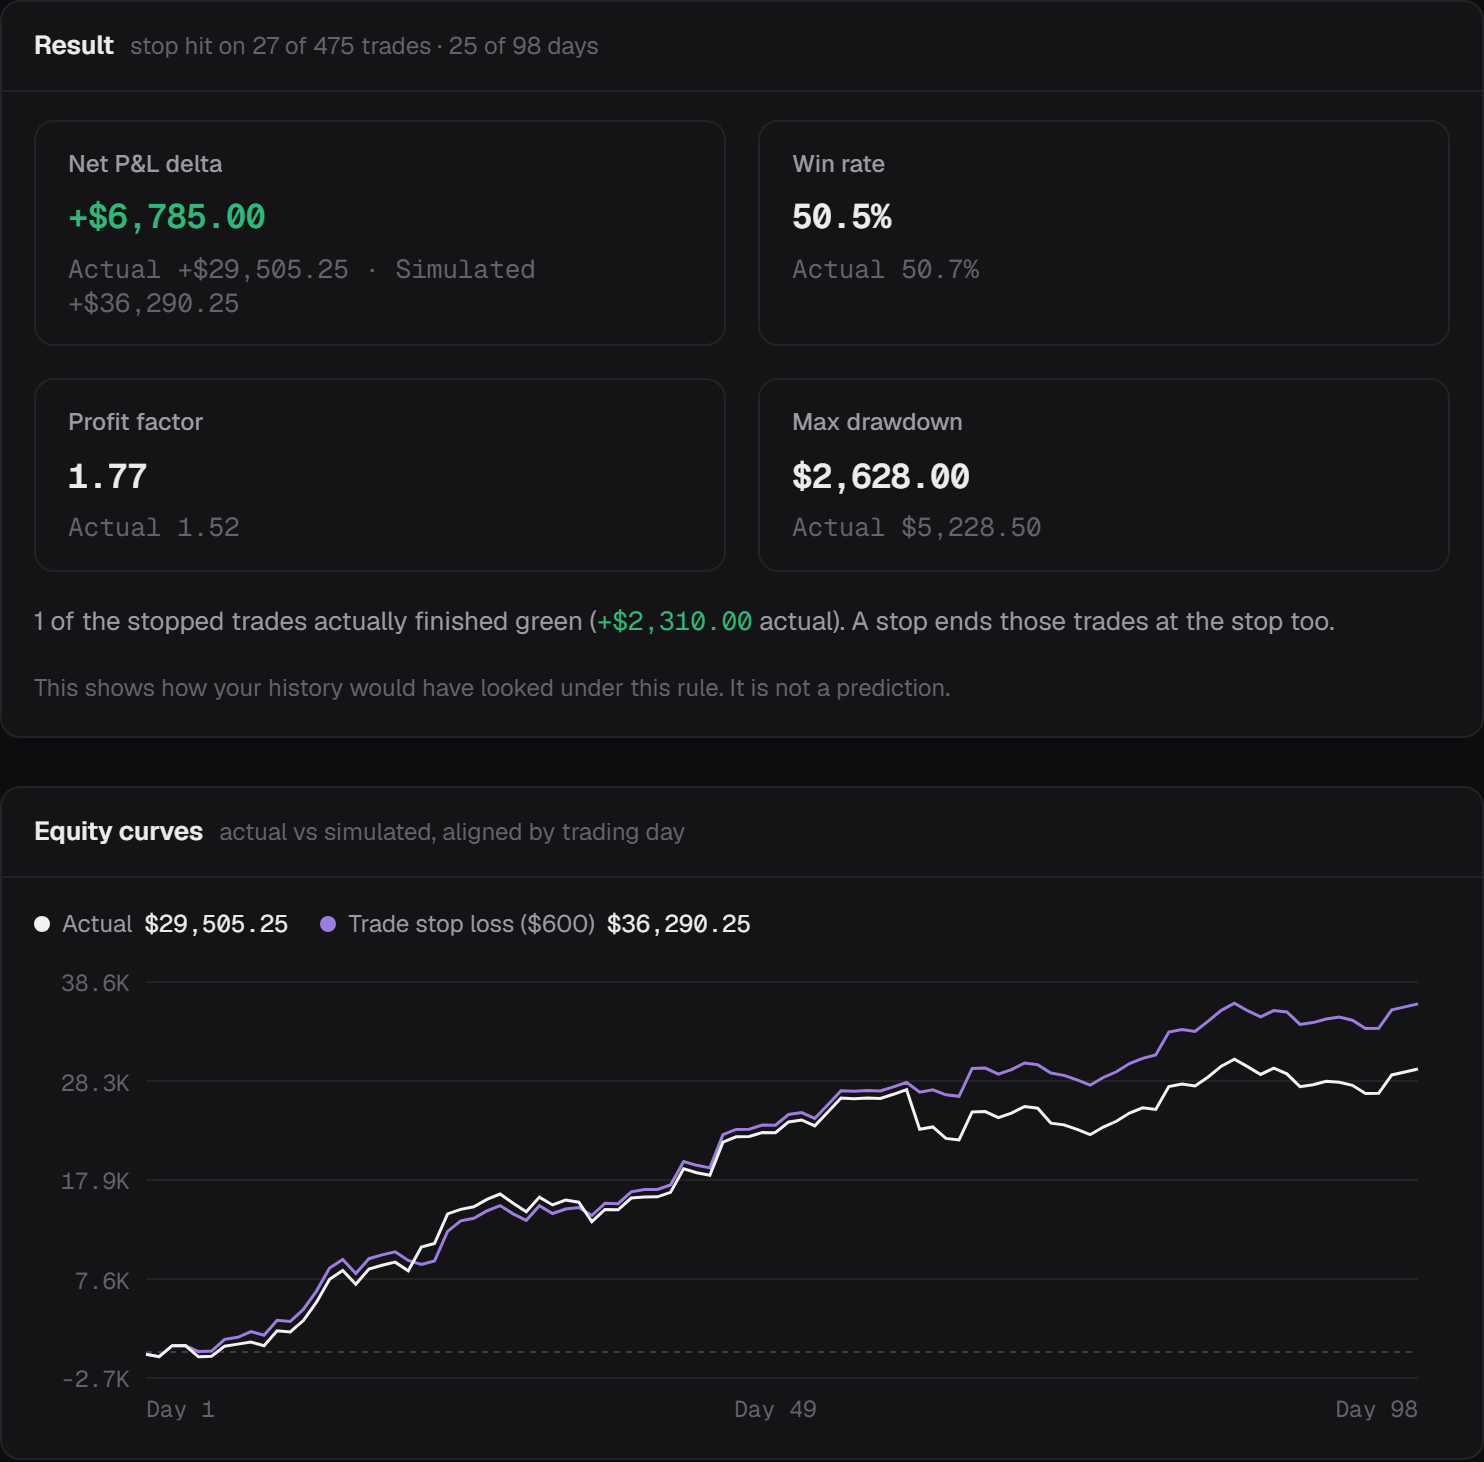
A word of caution, which the app gives you too: this is not a prediction. Tuning settings until the past looks perfect is a classic way to fool yourself. Prefer rules where the nearby settings tell the same story.
When a rule survives that test, arm it as a guardrail and it watches your live session from then on. Plan, trade, review, test, arm. That is the whole loop.
Most trading journals support dozens of brokers and platforms. Ours supports one, on purpose. Being built only for Sierra Chart lets the journal do things a generic importer cannot:
The Bridge runs on Windows with 64-bit Sierra Chart. Without it, everything else in the journal works from Trade Activity Log imports.
The journal is in open beta. Every account runs Pro, Bridge included, free while the beta runs.
Not as such. Sierra Chart records every fill in the Trade Activity Log and shows your results in Trade Statistics, which is a solid foundation. What it does not have is a place to plan your day, tag your mistakes, write notes, or see what a habit has cost you over months. That is what a trading journal adds on top of Sierra Chart’s data.
No. Guardrails warn you on screen and, with the Bridge, as a Windows notification. To block orders or flatten at a daily loss limit, use Sierra Chart’s own risk management settings or your prop firm’s limits. We recommend using both.
No. Everything works from Trade Activity Log imports. The Bridge adds live sync, chart screenshots, guardrail notifications, View in Sierra Chart and exit benchmarks. It requires Windows and 64-bit Sierra Chart.
Yes. Live, sim and prop firm accounts sit side by side, and you can filter every page by account.
Because your trades arrive on their own, the review is only the part a machine cannot do: rate your plan, tag your trades and write a short note. For most day traders that is a few minutes, and most of it is tagging. Do it the same evening, while you still remember why you moved that stop.
Your trades are stored in your journal account. The journal never asks for broker credentials. With the Bridge, exit benchmarks are computed on your own PC, and only the results are uploaded.
Better charts help you see the market. Discipline decides whether what you see turns into results. A Sierra Chart journal makes discipline concrete: rules written down before the session, a warning during it, and an honest price after it.
Start small. One plan, two guardrails, two weeks of honest mistake tags. The numbers will tell you what to change next.
Updated October 2026. Trading futures involves substantial risk of loss and is not suitable for every investor. Nothing in this article is financial advice. Sierra Chart is a trademark of its owner. boostyourcharts is an independent product.

Understanding the statistical edge in trading is essential for long-term profitability. This article delves into what a trading edge is, why it's crucial, and…
Read article
Explore how to effectively set up and use Sierra Chart for trading in this step-by-step guide. Covering installation, account creation, tutorials, and service package…
Read article
Unlock the secrets of professional day trading with Sierra Chart's Depth of Market (DOM) and order flow tools. This guide delves into how traders…
Read article