Your cart is empty.
No products in the cart.

In the fast-paced world of day trading, having the right tools is crucial for success. Sierra Chart, a comprehensive and versatile trading platform, is particularly favored by professional day traders for its Depth of Market (DOM) and order flow analysis capabilities. This article explores how Sierra Chart’s DOM and its accompanying advanced tools can enhance trading strategies.
The Depth of Market (DOM) feature in Sierra Chart provides a real-time view of pending buy and sell orders at different price levels, essential for day traders. To access DOM, traders navigate to Trade > Trading Chart DOM On in the top menu. For further customization, the option Trade > Customize Chart/Trade DOM Columns allows tailoring the DOM to individual preferences.
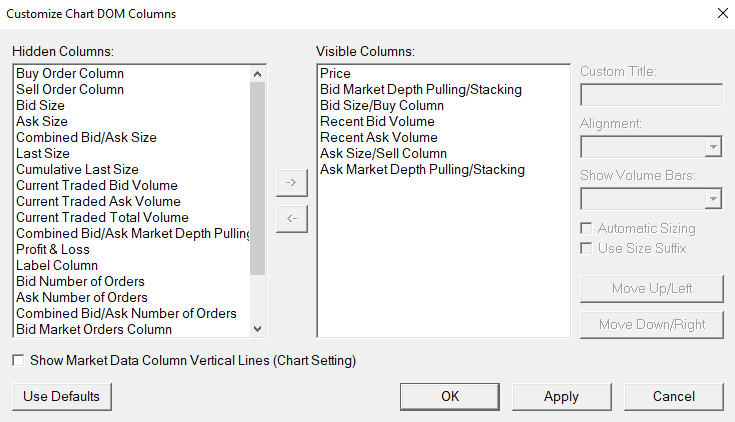
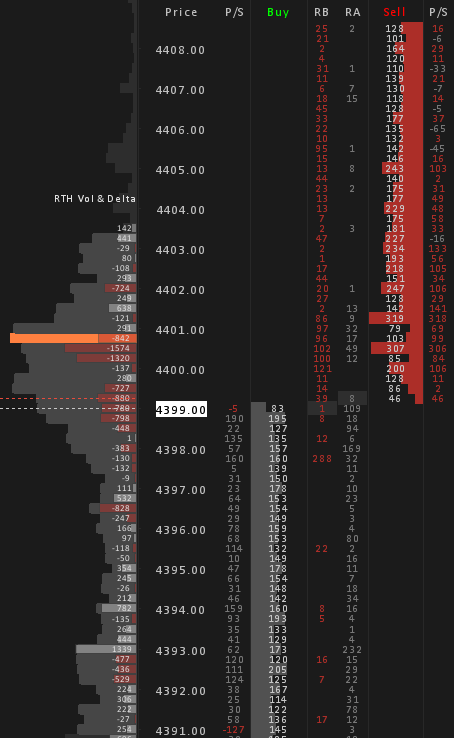
A professional DOM setup in Sierra Chart reveals critical information such as Bid and Ask Market Depth Pulling/Stacking, Buy and Sell Columns with resting orders, and Recent Bid/Ask orders.
Pulling occurs when a significant number of orders at a particular price level are withdrawn or canceled, indicating a potential shift in market sentiment or strategy.
Conversely, stacking refers to the accumulation of a large number of orders at a specific price level, suggesting strong interest in buying or selling at that price. For example, heavy stacking of sell orders slightly above the 4400 key level indicates potential resistance.
In Sierra Chart, the Buy and Sell Columns enable you to place trades simply by clicking within the columns. These columns also display resting orders, and in this particular DOM example, they are visualized with a Volume Profile, making it easier to spot large orders.
Recent Bid/Ask orders in DOM trading represent actual market orders that have been executed, contrasting with resting orders which are potential future trades that can be modified or pulled. These real orders provide insight into genuine market activity, showing the true demand and supply at the moment.
This information is particularly valuable as it helps traders avoid being misled by tactics like spoofing, where large resting orders are placed and then moved to manipulate market perception. Keeping track of these “real” orders helps traders understand what is truly happening in the market, aiding in more informed and strategic decision-making.
Sierra Chart’s DOM, when complemented with advanced market depth tools like Volume Profiles, Footprint Charts, and the Market Depth Historical Graph (Heatmap), offers a more complete view of market dynamics, aiding in informed decision-making.
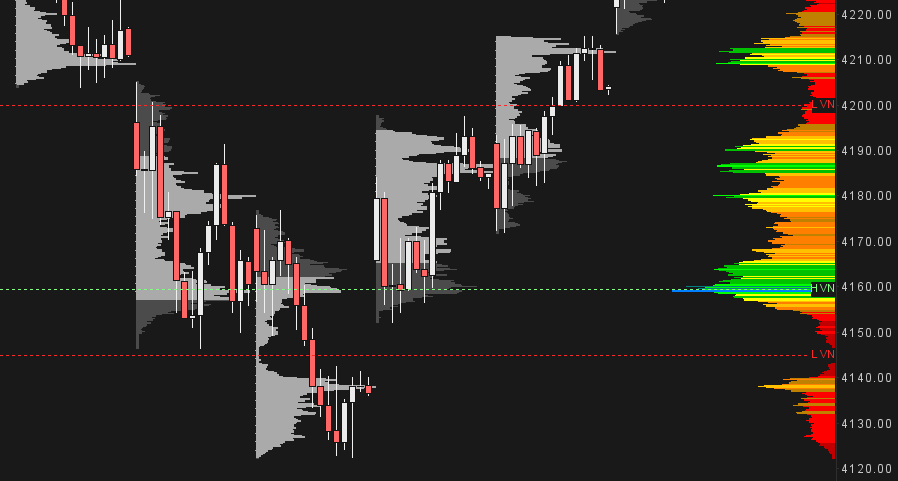
Volume Profiles in Sierra Chart provide a comprehensive view of market activity, highlighting areas of high and low volume at different price levels over a specified time frame.
Using Volume Profiles effectively can help traders identify strategic entry and exit points, enhancing their trade execution and management.
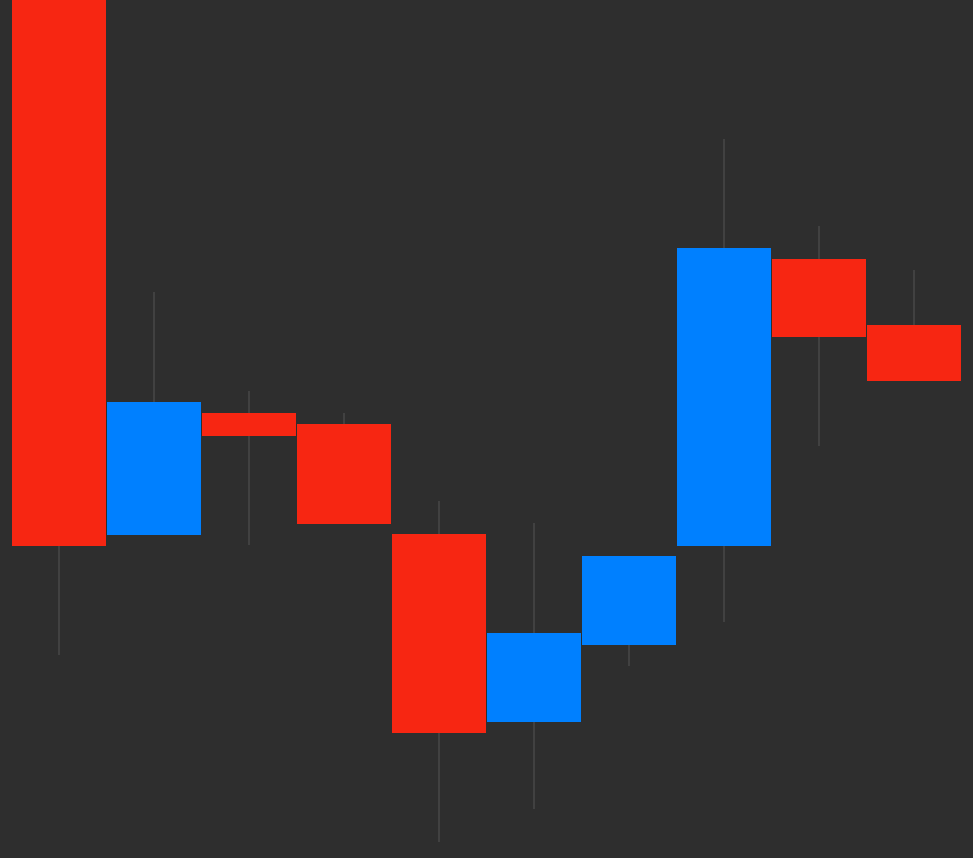
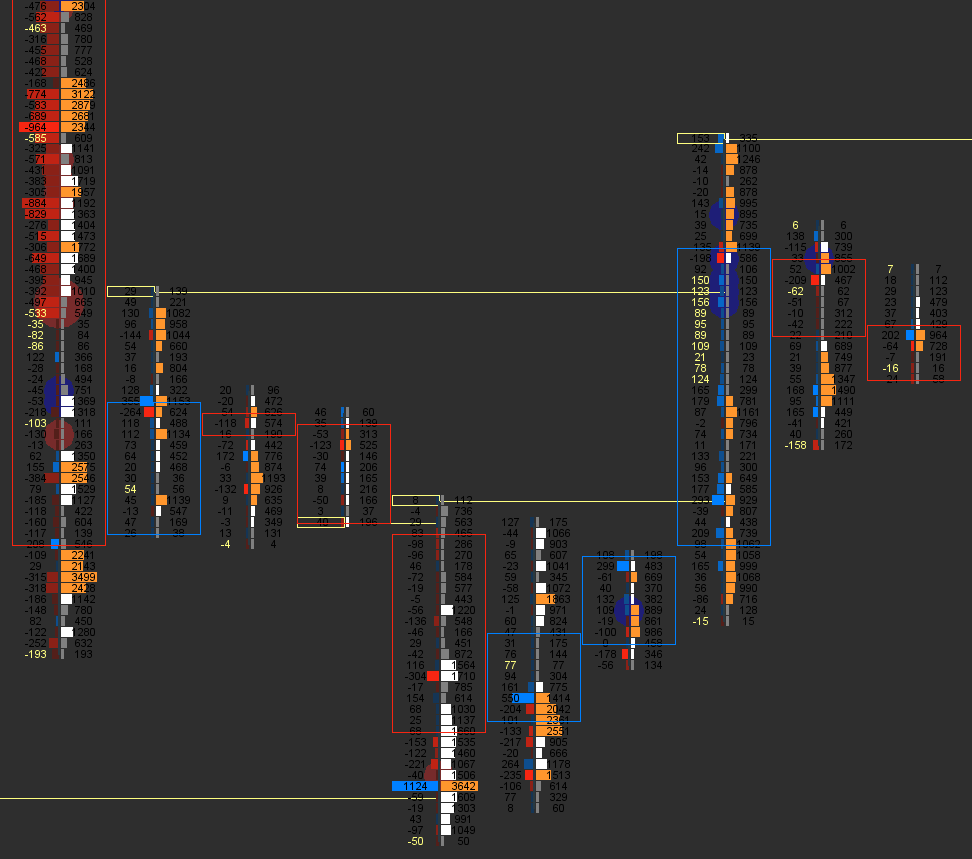
Footprint Charts in Sierra Chart offer a detailed view of market activity at each price level within a candlestick, making them invaluable for analyzing market dynamics and imbalances.
Footprint Charts are essential tools for traders aiming to gain a deeper understanding of market movements, enabling them to identify market imbalances and align their strategies with prevailing market trends.
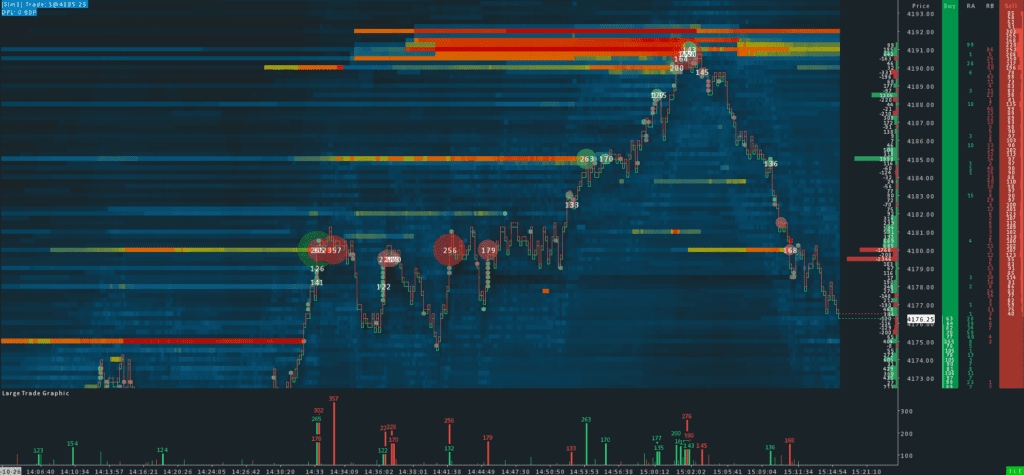
The Heatmap in Sierra Chart is a dynamic tool that visualizes historical market depth data, offering unique insights into market liquidity and potential price movements.
The Heatmap, combined with other tools like Volume Profiles and Footprint Charts, equips traders with a comprehensive understanding of market dynamics, aiding in the formulation of more effective trading strategies.
Sierra Chart’s suite of advanced trading tools, including Depth of Market (DOM), Volume Profiles, Footprint Charts, and the Market Depth Historical Graph (Heatmap), offers day traders a significant advantage in the market. These tools provide crucial insights into market depth, order flow, and trading activity, enabling traders to make informed decisions and develop sophisticated strategies.
Embracing these tools in day trading enhances a trader’s ability to analyze market conditions and act with precision and confidence. As the trading landscape continues to evolve, leveraging advanced tools becomes essential for maintaining a competitive edge in the fast-paced world of day trading. The integration of Sierra Chart’s DOM and its advanced market depth tools represents a significant step forward in the pursuit of trading excellence and success.
For traders looking to further enhance their trading strategies, boostyourcharts.com offers a range of specialized Sierra Chart Templates. Go and check them out!

Understanding the statistical edge in trading is essential for long-term profitability. This article delves into what a trading edge is, why it's crucial, and…
Read article
Explore how to effectively set up and use Sierra Chart for trading in this step-by-step guide. Covering installation, account creation, tutorials, and service package…
Read article
Sierra Chart is a comprehensive trading platform designed for intermediate to advanced traders. Its advanced technical analysis, customizable tools, accessible pricing, supportive community make…
Read article