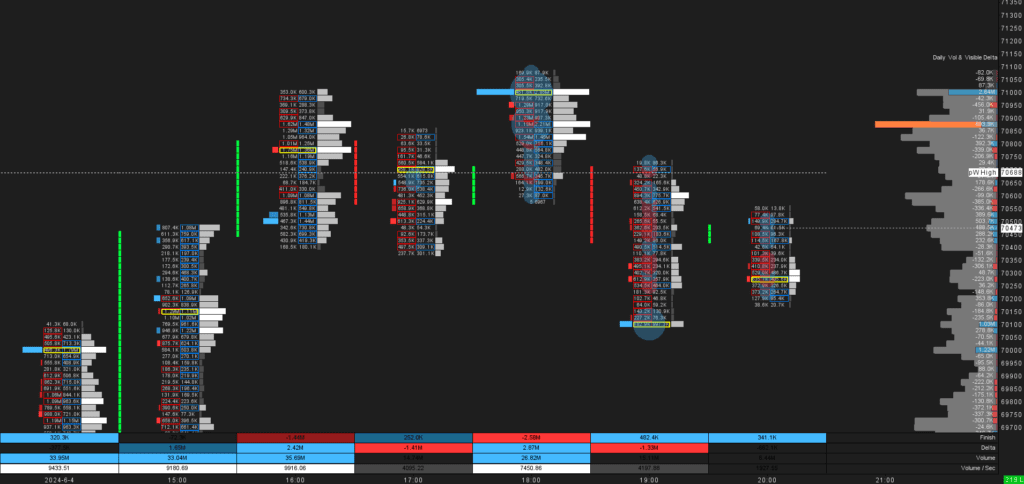
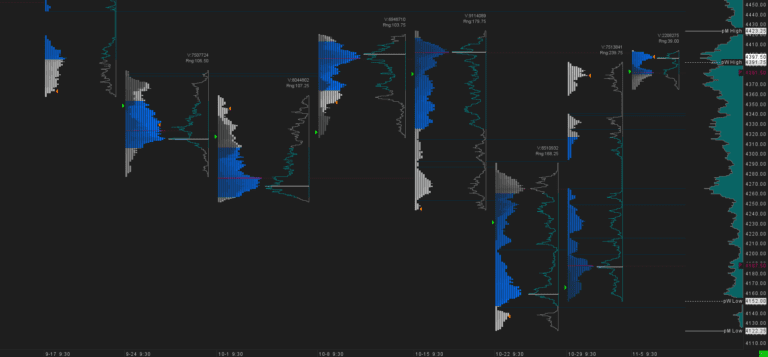
Bitcoin Footprint Delta 1H Chart – This template provides an in-depth footprint analysis, featuring Delta in the left column, Bid Vol x Ask Vol in the middle, and Volume in the right column. Key features include:
- Absorption Detection: Delta displayed next to each bar and summarized for all visible bars on the right edge.
- Detailed Volume Analysis: Bid Vol x Ask Vol numbers in the center, and overall volume to the right of each bar and for the entire day.
- Candlestick Visualization: Green/red candlestick bodies for each bar.
- Comprehensive Metrics: Footprint calculated values such as FinishDelta, Delta, Volume, and Volume/s at the bottom.
- Large Volume Trade Indicator: Big trades appear as bubbles on the footprint.
- Automatic Level Generation: Key levels like Open, past week’s high/low, and past month’s high/low are automatically plotted.
Perfect for traders looking to spot market absorption and make informed decisions based on detailed volume and delta metrics.