Templates / Volume Profile / Daily RTH Volume Profiles with Candlestick
What's Included

Inside this template.

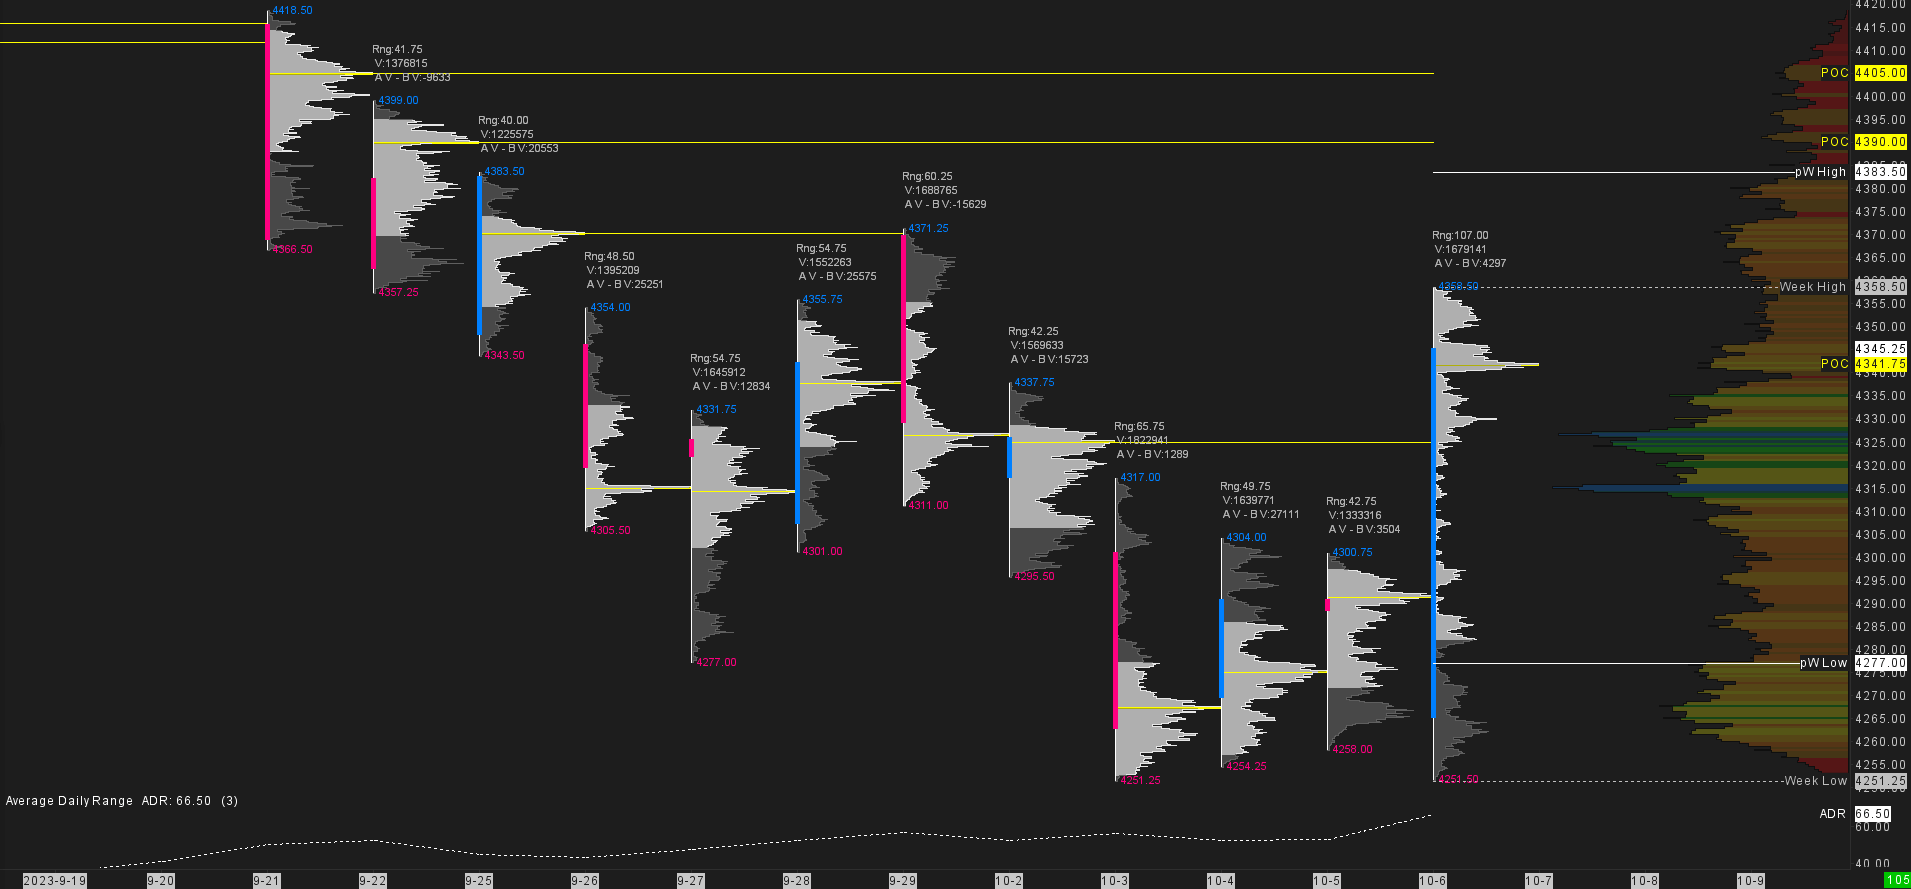
Daily RTH Volume Profiles with Candlestick is an overview starter template for day traders who want to understand the bigger picture. Every regular trading session (RTH) is shown as a daily candle with its own volume profile and key numbers, so you see the auctions of as many days as you load into the chart.

What is on the chart

  • Daily RTH candles, each with its own volume profile
  • Extended Point of Control (POC) lines for each day
  • Daily RTH data for every session: high and low, range, volume, delta volume and Point of Control
  • Volume profile of all visible bars on the right side of the screen
  • Levels: previous month high and low, previous week high and low, current week high and low
  • Average Daily Range (ADR) graph

Trending or balancing?

The daily POCs answer the first question of every trading day. When the POCs step in one direction day after day, the market is trending. When they cluster in one area, the market is balancing. The extended POC lines make that pattern easy to see at a glance.

The automatic weekly and monthly levels help you understand where you are in the bigger picture, without redrawing anything at the start of a new week or month.
Good to know

Good to know

FAQ.

What Sierra Chart package do I need?
We recommend Sierra Chart Package 10 for this template.
How do I install the template?
1) Download the included files. 2) Place them in your Sierra Chart Data folder. 3) Open the chartbook. Detailed Installation Guide →
Can I use the template for all products?
Yes. This template is not tied to one contract - it is built around the trading session, so it works on any market once you match the session times, scaling and volume settings to that instrument. See the official Sierra Chart documentation for guidance.
Scroll to Top