Your cart is empty.
No products in the cart.

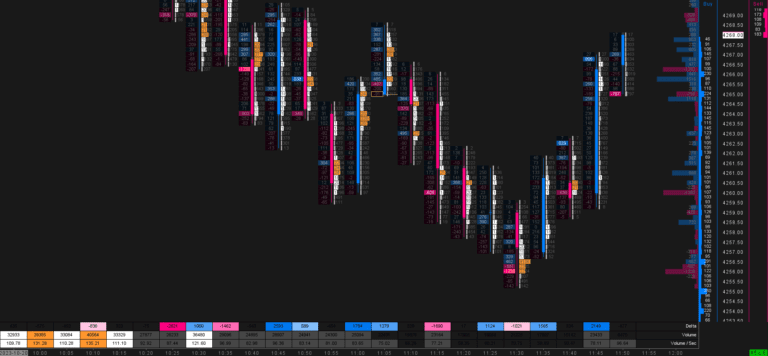
Footprint 5MIN Delta and Volume is a classic time-based Sierra Chart footprint for ES, NQ, Crude Oil and Gold futures. Every 5-minute bar shows its delta and total volume at each price, with a transparent candlestick body behind the numbers. If you are new to footprint charts, this is the most familiar way in: the bars line up with the 5-minute candles you already know.
Time-based bars make the footprint easy to compare: every bar covers the same 5 minutes, so a bar with twice the volume really had twice the activity. Look at where in the bar the volume sits. Strong buying delta at the high of a bar while price fails to go any higher means passive sellers absorbed the buyers. Strong selling delta at the low that cannot push price lower is the same picture on the other side. The calculated values under each bar give you the totals at a glance.
The unfinished-auction lines are a simple but useful map. An unfinished top or bottom is a level where the auction did not complete and price often comes back to it later in the session. The line stays extended until price revisits the level.
Pick your market above. Each optimization uses its own scaling and large-trade threshold, so the chart reads correctly from the first session. Need more than one market? Add the other optimizations at a reduced price before you add the template to the cart.