Templates / Volume Profile / Range Footprint Delta Volume
What's Included

Inside this template.

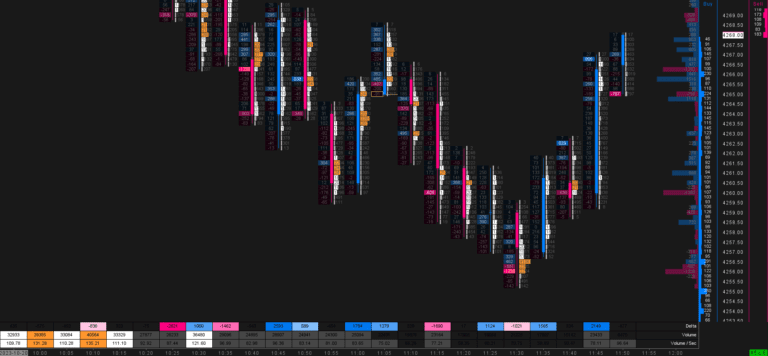
Range Footprint Delta Volume is a Sierra Chart footprint built on range bars for ES and NQ futures. A new bar only starts after price has moved a fixed distance: 20 ticks (5 points) on ES and 100 ticks (25 points) on NQ. Quiet periods shrink to a few bars and busy ones get the detail they deserve, so every bar on the screen carries a similar amount of price movement. Prefer time-based bars? The chart can be switched to a time-based bar period, like minutes, in the chart settings.

What is on the chart

  • Range bars: ES preset 20 ticks (5 points), NQ preset 100 ticks (25 points)
  • Footprint with three columns: delta on the left (green and red), total volume numbers in the middle (grey) and a per-bar volume profile on the right (green and red)
  • Candlestick body on the left of each bar
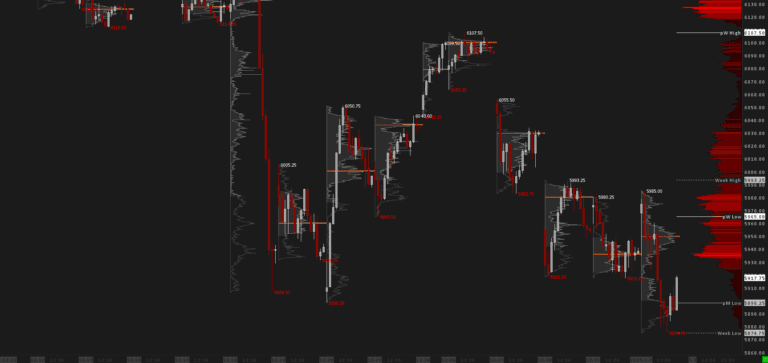
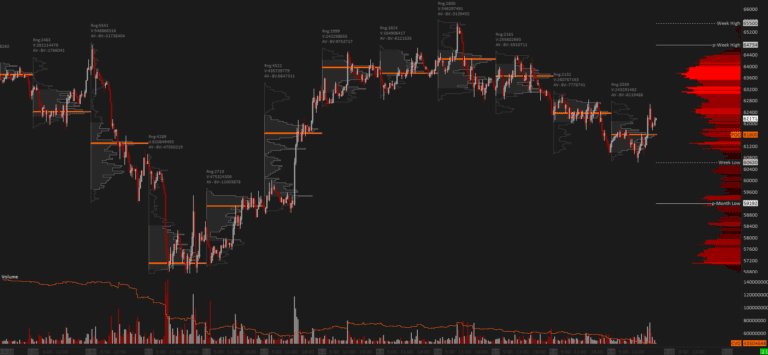
  • Volume Profile with total volume and a delta overlay that resets for the day and the overnight session
  • Delta Bars under the chart

Why range bars for a footprint

On a time-based chart, a 5-minute bar during lunch and a 5-minute bar after a news release look the same, even though one had far more trading. Range bars fix that. Each bar covers the same price distance, so you compare like with like. Range bars only show what really matters. A dull session without any movement does not need hundreds of bars for your analysis. With range bars you see what really happened.

The three-column layout gives you the full picture inside each bar. Delta shows who was aggressive, the volume numbers show how much traded and the small profile on the right shows where in the bar the volume concentrated.

Session-aware profile

The volume profile resets for the regular session and the overnight session, so you can see where value formed overnight and whether the day session accepts or rejects it.
Good to know

  • Choose ES or NQ above. Each comes with its own range size and filters.
  • Footprint (Numbers Bars) is an Advanced Sierra Chart feature. We recommend Package 11.
  • More options: Sierra Chart footprint templates.
  • Tip: the Tape On Chart indicator paints the Time and Sales tape directly on your chart, one row per order with big prints highlighted.
Good to know

FAQ.

What Sierra Chart package do I need?
We recommend Sierra Chart Package 11 for this template.
How do I install the template?
1) Download the included files. 2) Place them in your Sierra Chart Data folder. 3) Open the chartbook. Detailed Installation Guide →
Can I use the template for all products?
Yes. Each version of this template is tuned for a specific market - choose ES (S&P 500) and NQ (NASDAQ) above before adding to cart. For any other instrument, adjust the session times, scaling and volume settings to match.
Scroll to Top