Your cart is empty.
No products in the cart.

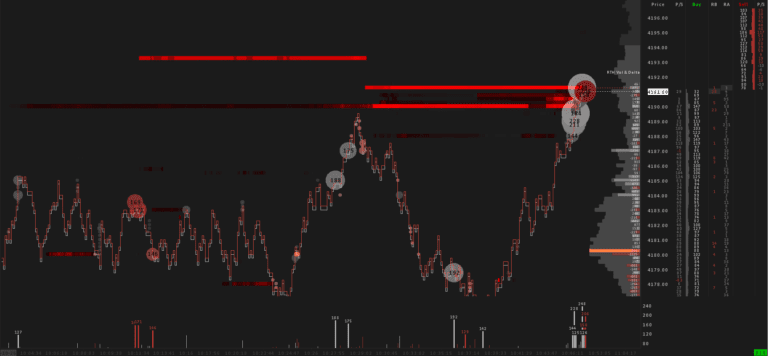
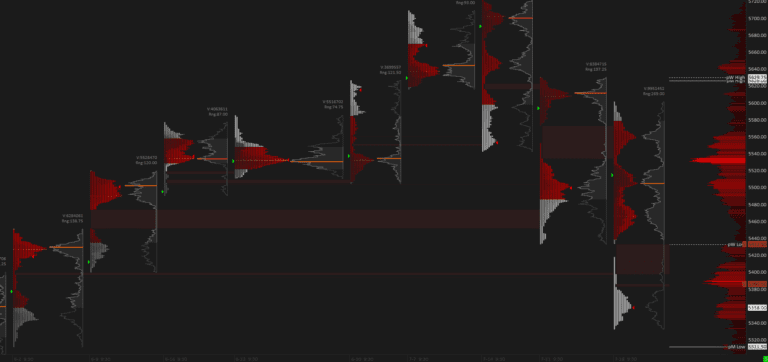
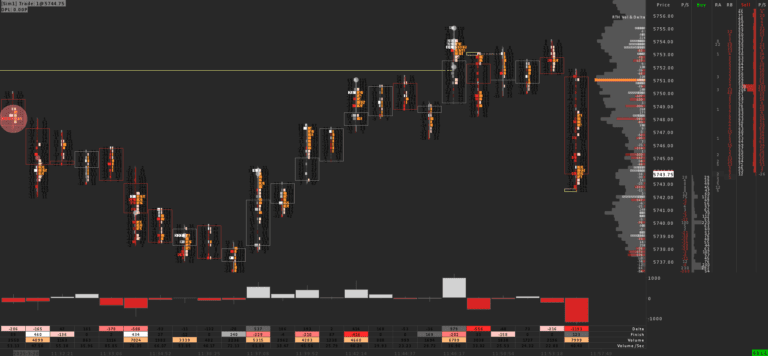
Volume Profiles RTH and Hologram is a Sierra Chart starter template for volume profile beginners. It shows a volume profile for each regular trading session (RTH) on a 30-minute chart, extends each day’s Point of Control and adds a volume profile hologram across all visible bars. It is a simple way to learn where the market traded the most and where it traded the least.
A volume profile shows how much volume traded at each price. The thick areas are high volume nodes (HVN). That is where the market likes to trade the most and they work like a magnet for price. The thin areas are low volume nodes (LVN), prices where the market traded very little because it lost interest there. An LVN can act as support or resistance. From there price often gets pulled back to the last HVN or moves on to the next one.
The hologram in the background draws these nodes for all visible bars, so you see the HVNs and LVNs of the last days at a glance.
The highlighted Point of Control (POC) of each session is the price with the most volume that day, basically the biggest HVN of the session. This template extends every POC to the right until price trades through it again. When price enters the territory of a prior session, its untested POC is a likely target. The market likes to retest its HVNs and the POC is the biggest one of them.