Your cart is empty.
No products in the cart.
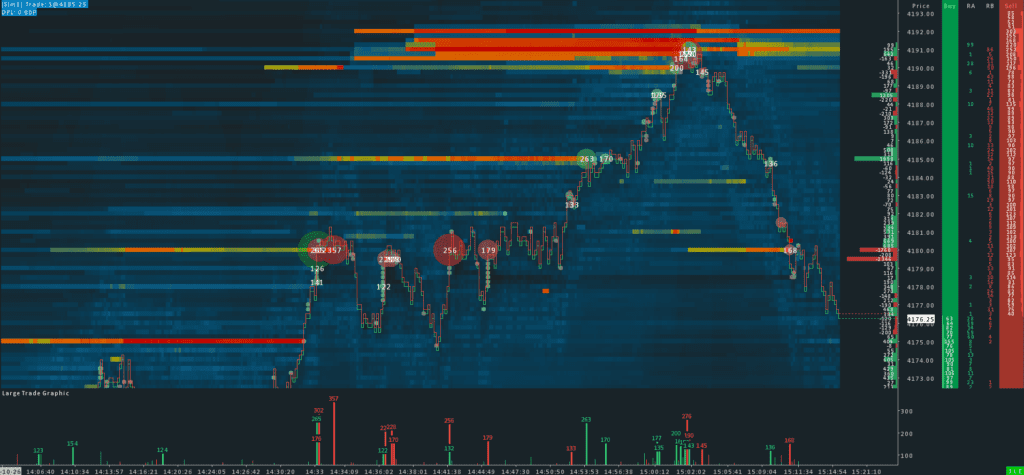
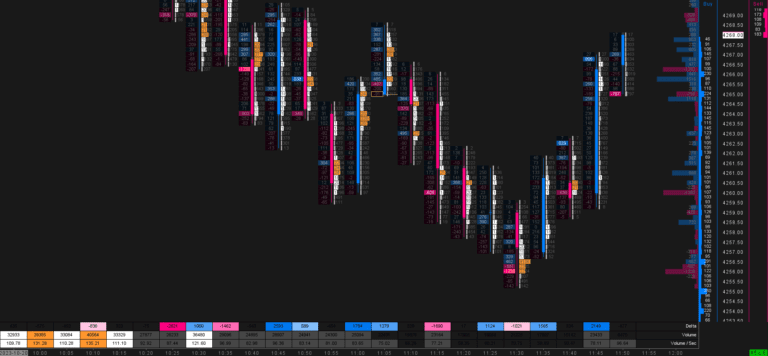
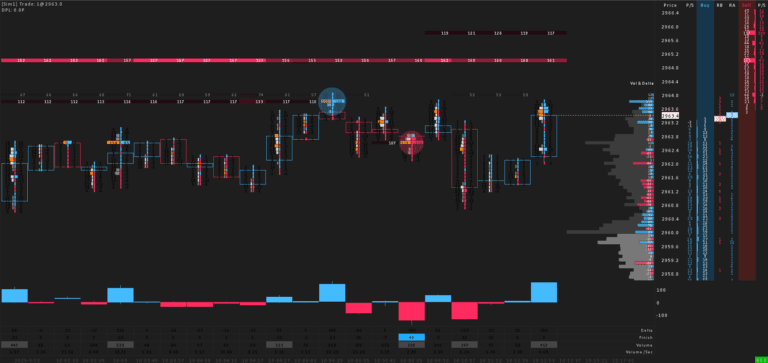
Orderflow Chart with Custom Studies is a highly zoomed-in orderflow chart for Sierra Chart, made to time your entries. It combines a ready-to-trade DOM, a volume delta profile, a smoothed market depth heatmap, iceberg detection and two custom studies that make large trades impossible to miss. Optimizations are available for ES and NQ futures.
Your levels come from the higher-timeframe charts. This chart answers the last question: is now the moment? The orderflow chart shows every burst of activity, the large-trade studies show who is behind it and the DOM shows what happens in the book while price approaches your level.
Bid size and ask size in the DOM show the resting limit orders on each side of the book. Recent bid volume and recent ask volume show the market orders that actually traded at each price, the aggressive buying and selling that moves the market.
Both custom studies are enhanced versions of Sierra Chart’s standard large-trade marker, built for more visibility in a fast market. Large Trade Text writes the exact quantity onto a transparent bubble for each large trade, which the standard Sierra Chart marker does not support. Large Trade Graphic repeats the large trades as a graphic at the bottom of the screen, so you see at a glance when the big prints came in.