Your cart is empty.
No products in the cart.

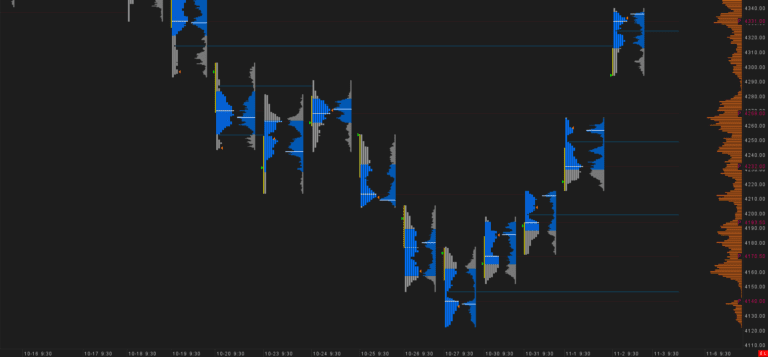
30MIN Daily Volume Profiles puts a volume profile on every trading day of a 30-minute candlestick chart in Sierra Chart, with optimizations for ES, NQ, Crude Oil and Gold futures. It is the “price map” chart of the Crimson Day Trading Suite: each day gets its own Point of Control and Value Area and a composite profile over all visible days shows the levels that keep mattering.
The daily profiles show where each session found value. When several days in a row share a similar Value Area, the market is balancing and the edges of that area are where trades tend to set up. When a new day builds value outside the old range, the market is trending. As long as it keeps trending, the Value Areas and even the highs and lows of prior days get rejected. When the market breaks back into yesterday’s Value Area, that usually comes with a retest of yesterday’s POC. The composite profile on the right sums it all up.
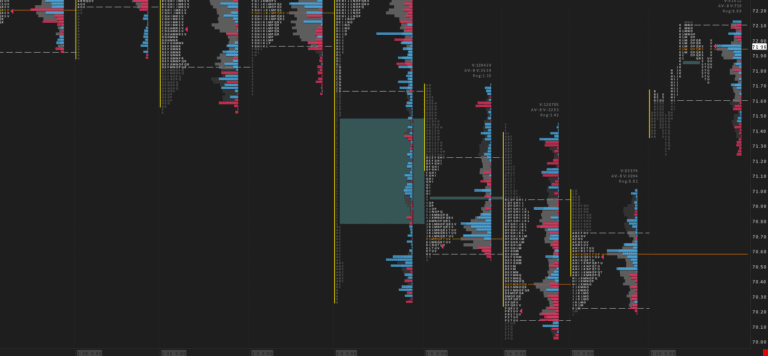
High volume nodes (HVN) are the prices where the market likes to trade the most. They act like a magnet and price tends to get pulled back to them. Low volume nodes (LVN) are prices where the market did not trade much. It lost interest there. An LVN can act as support or resistance and from there price often gets pulled back to the last HVN or moves on to the next one.
The weekly and monthly highs and lows are drawn automatically, so you never have to redraw them each Monday or at the start of a new month.
Use it before the open to mark your levels for the day, then switch to a faster chart for execution. In the Crimson Day Trading Suite it is chart 3 of 6, between the daily view and the Renko day-levels chart.