What's IncludedSix charts. One workflow.
From the zoomed-out weekly auction map down to the trigger chart. Each chart hands off to the next.
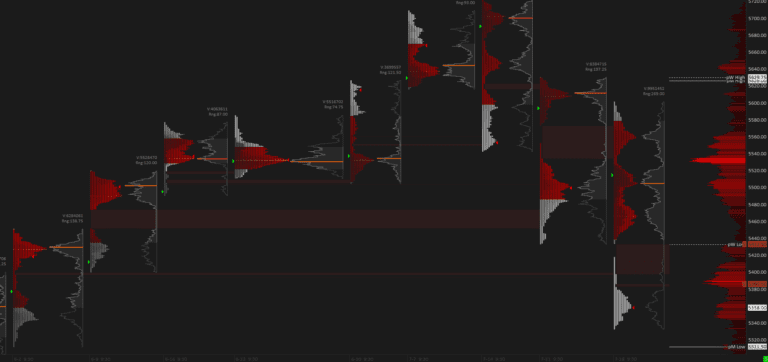
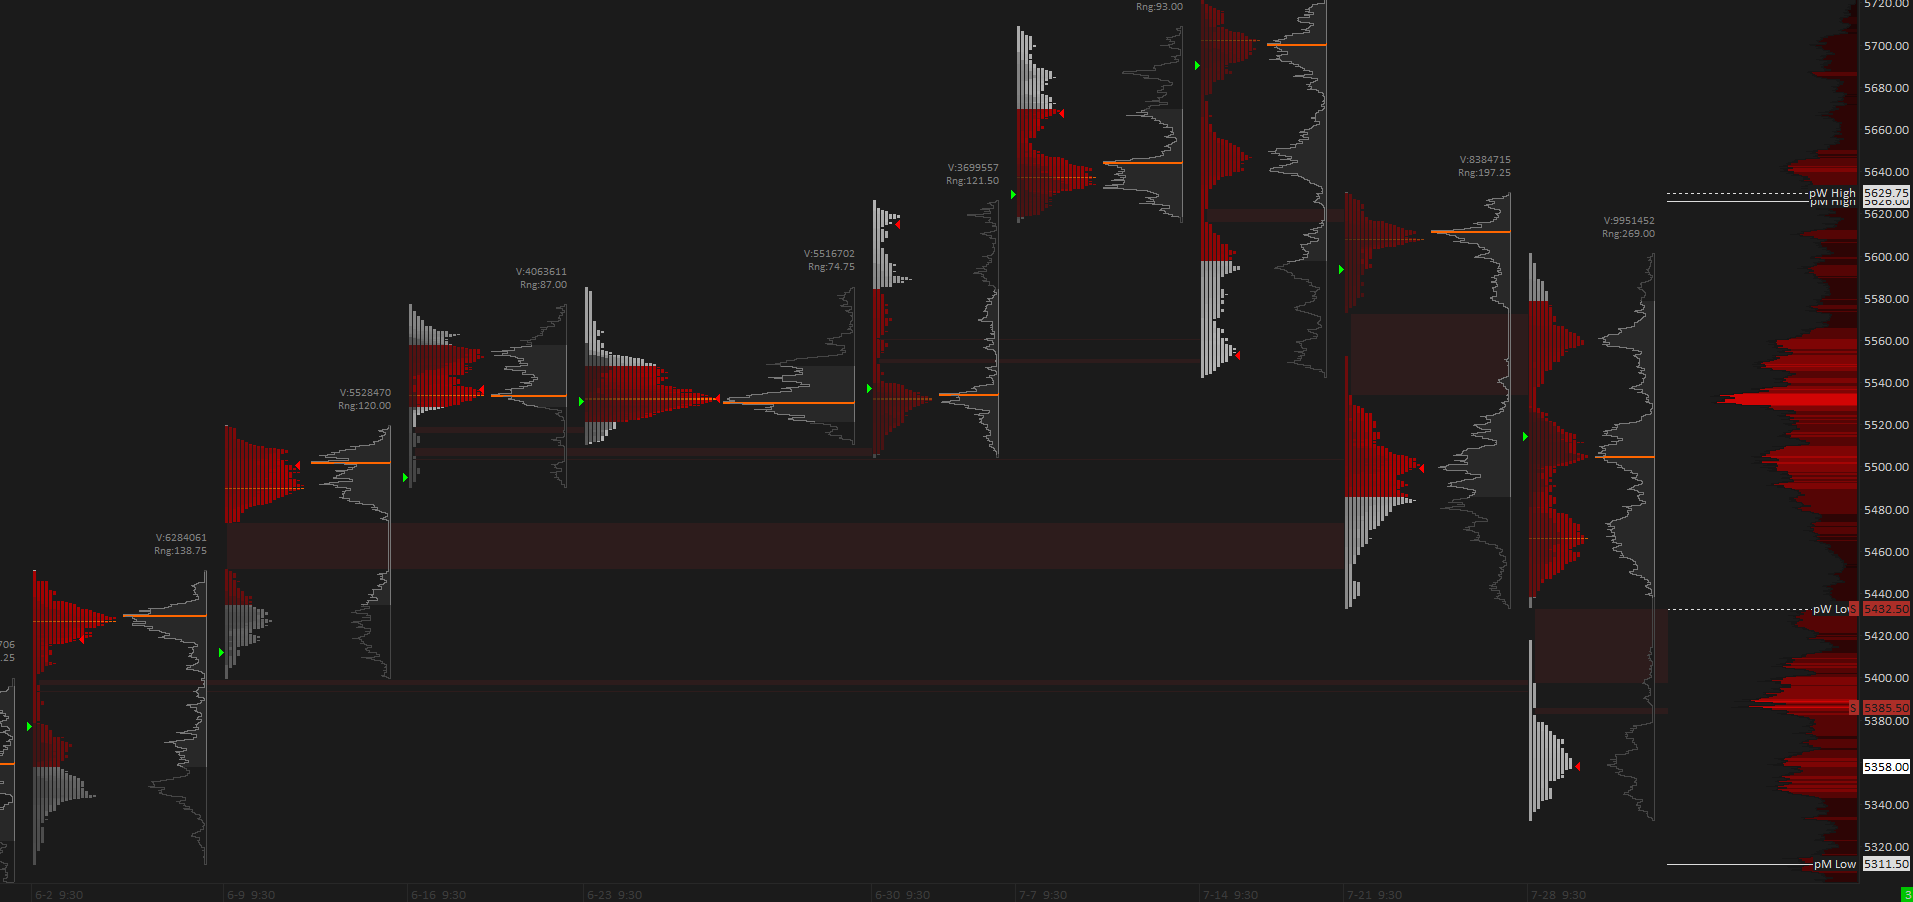
01 · Weekly OverviewTPO / Volume Profiles Weekly
Begin with a zoomed-out market perspective for RTH on the weekly timeframe. TPO and volume profiles help you understand the overall market themes. Shaded TPO profiles give a compact view of the auction process based on time.
more
- Shaded TPO profiles show the auction process based on time - darker shades mark the earlier blocks created within the week.
- Single prints highlight gaps and weak points in the market structure.
- Volume profiles add a compact, volume-based view for cohesive auction analysis.
- Includes a custom-coded Open Marker that is not available in standard Sierra Chart.
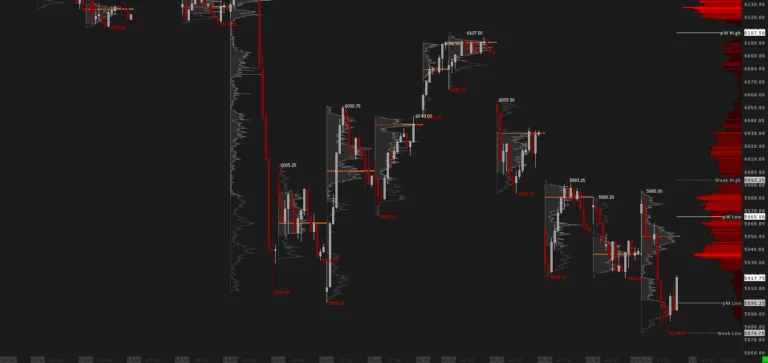
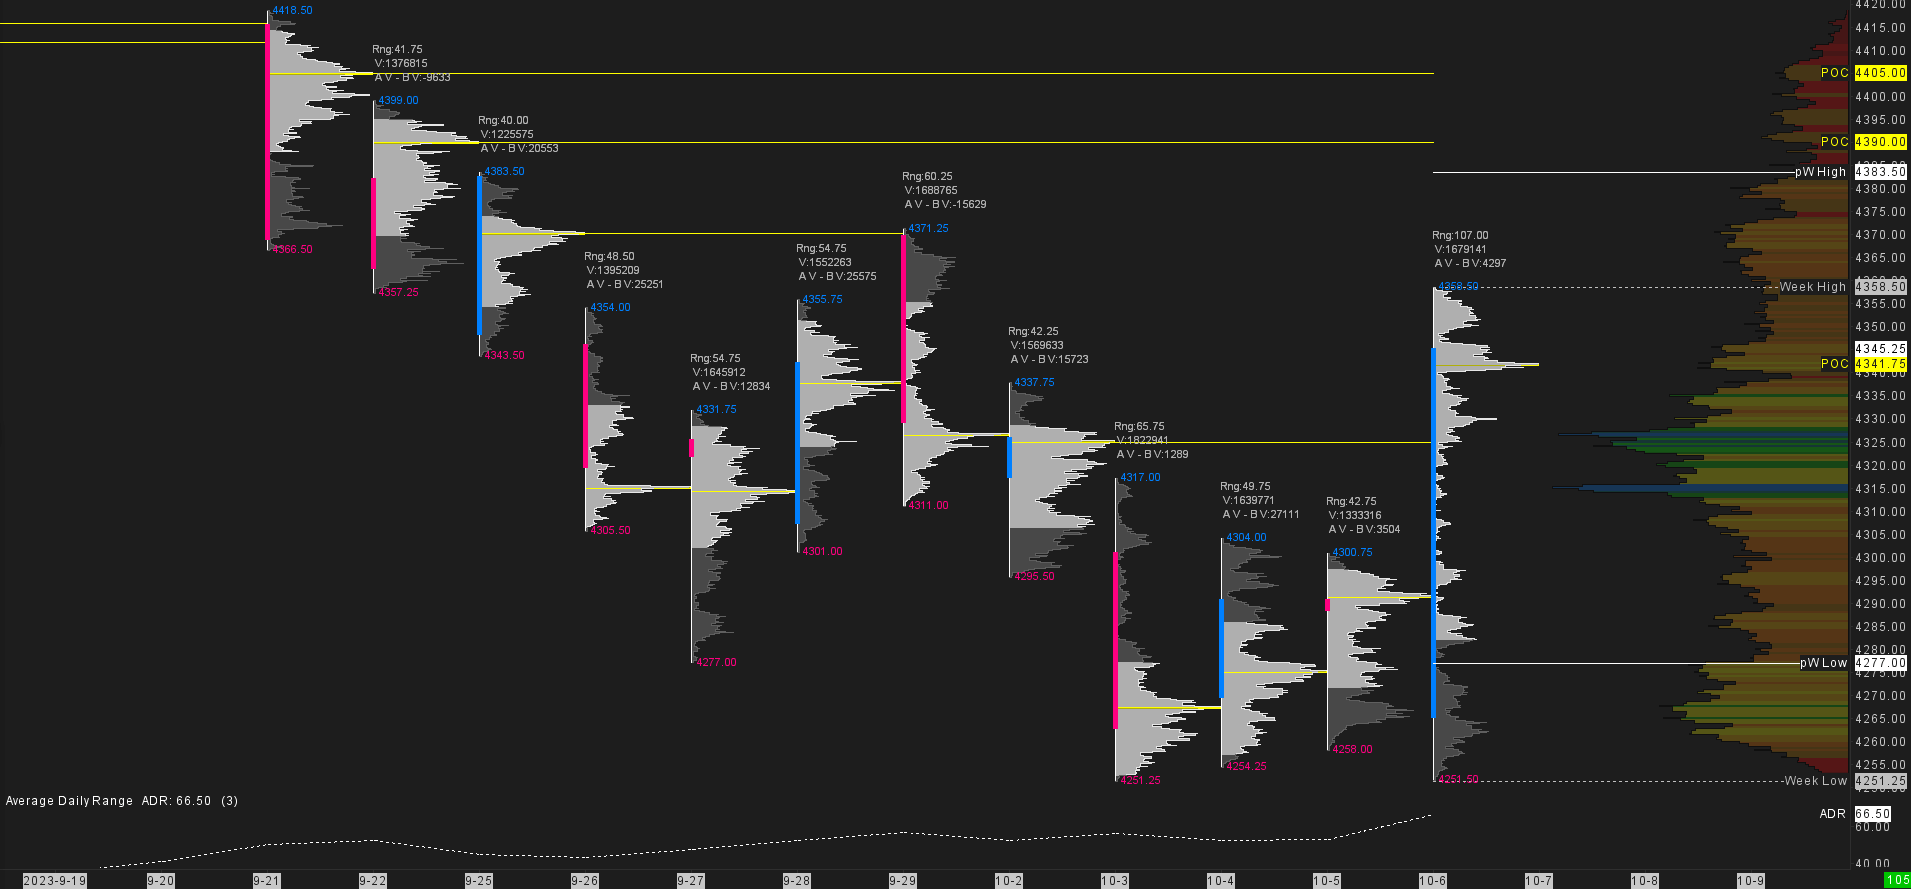
02 · Daily StructureDaily Candles with Volume Profiles
Deeper into the analysis while keeping the overall market themes in view. The Daily RTH chart provides a closer look at daily activity, adding candlestick analysis on top of volume profiling.
more
- Candlestick analysis layered on top of volume profiling for a closer read of daily activity.
- Includes an Average Daily Range (ADR) graph.
- Per-day Volume Profile metrics: Range, Volume and Delta.
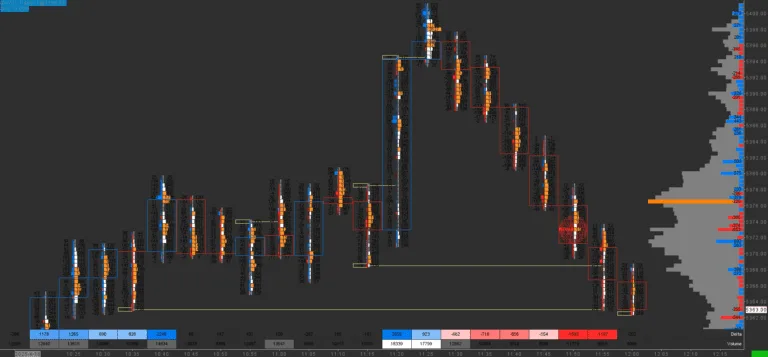
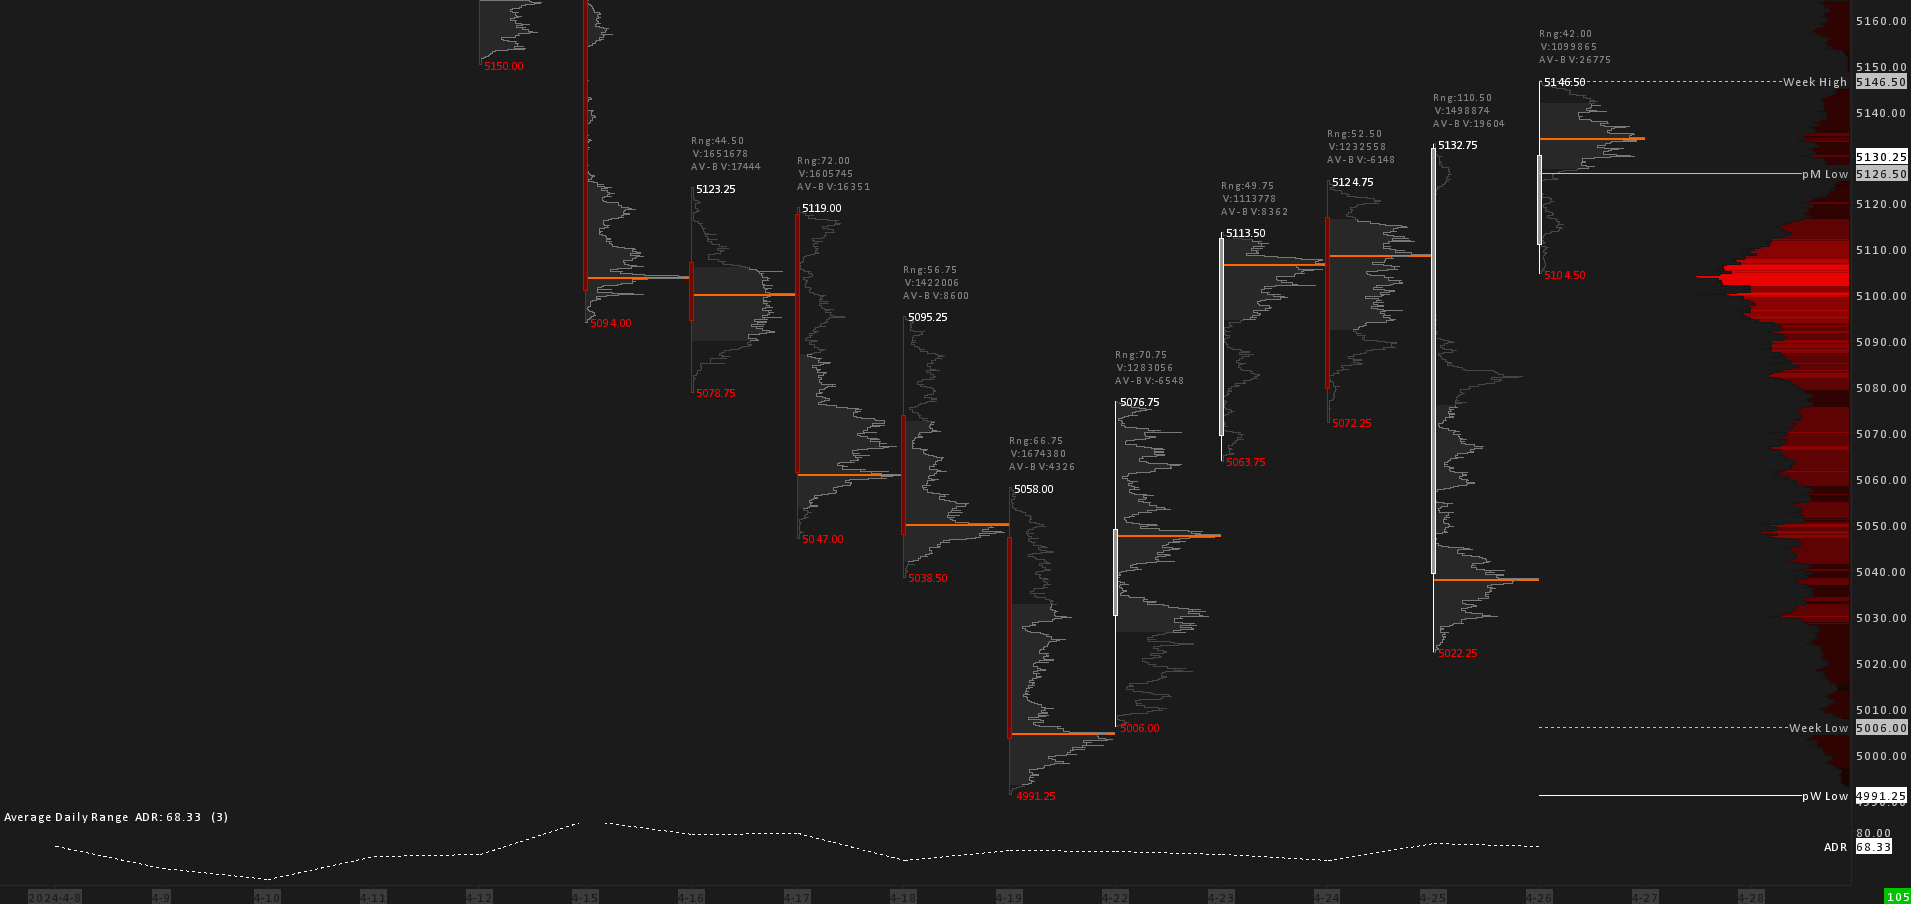
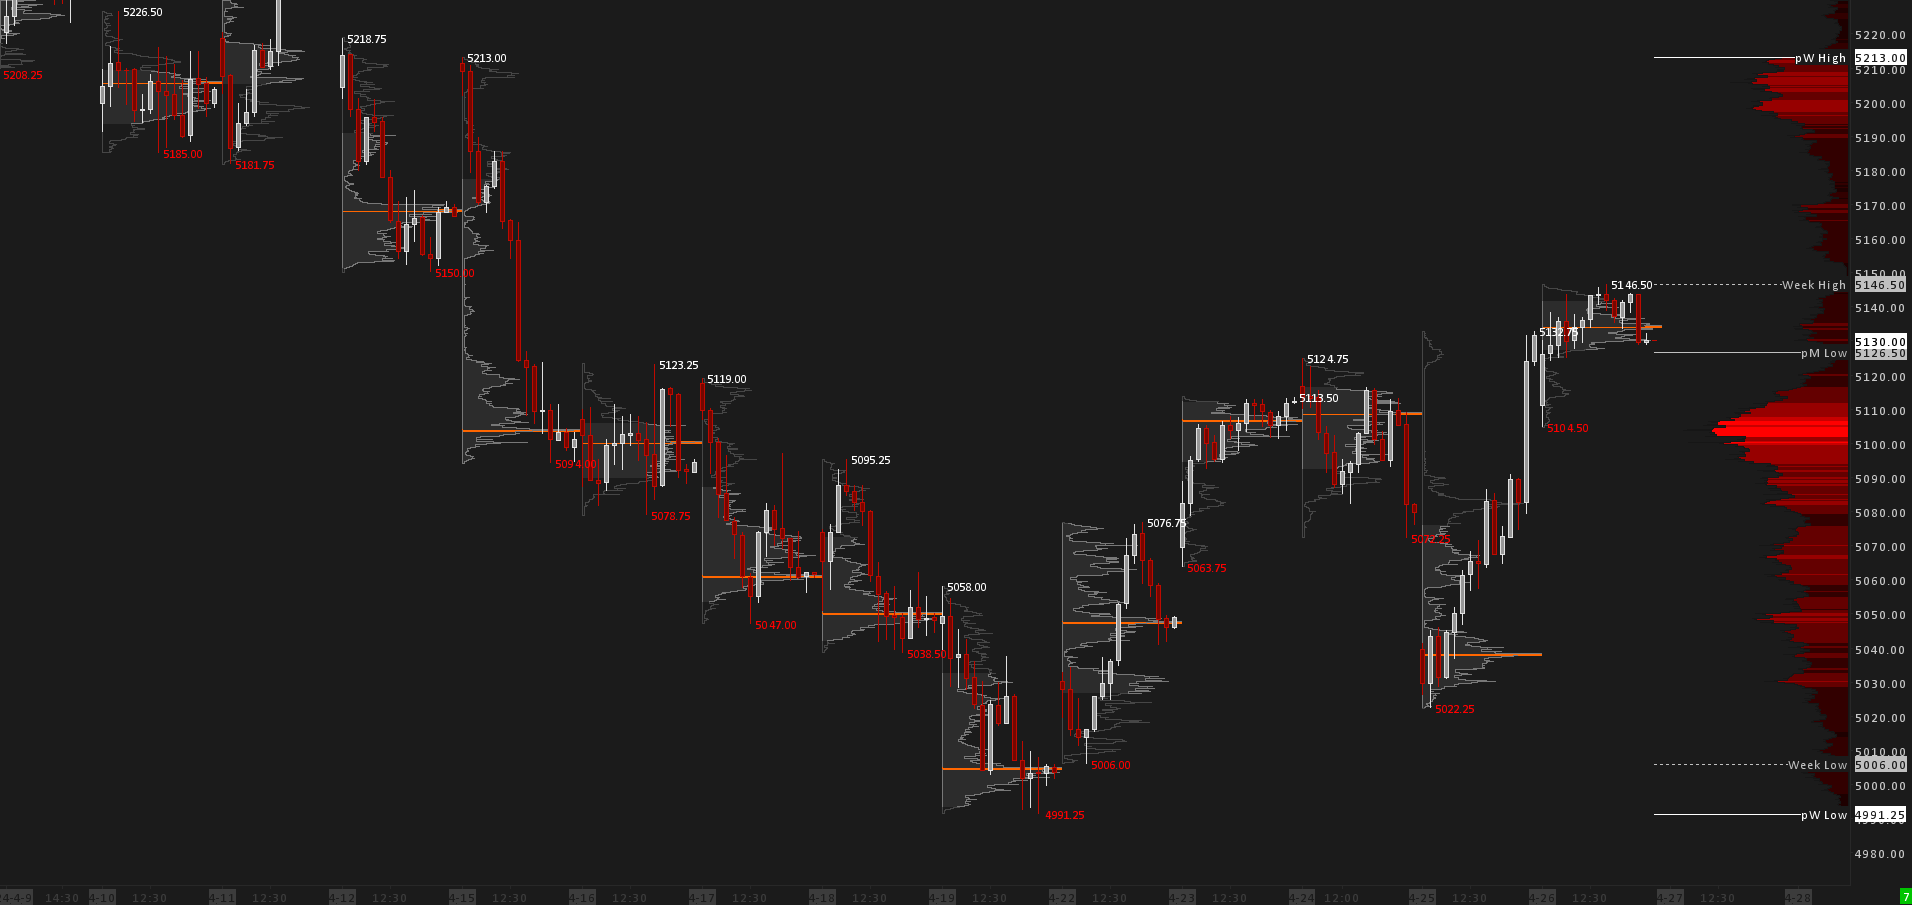
03 · Intraday Map30MIN Candles with Volume Profiles
Daily RTH activity examined through 30-minute candles. Price action in greater detail, in tandem with volume profiling. This is where your "price map" of key support and resistance levels takes shape.
more
- 30-minute candles examine the daily RTH activity in finer detail.
- Volume profiling builds your intraday "price map" by marking the key support and resistance levels.
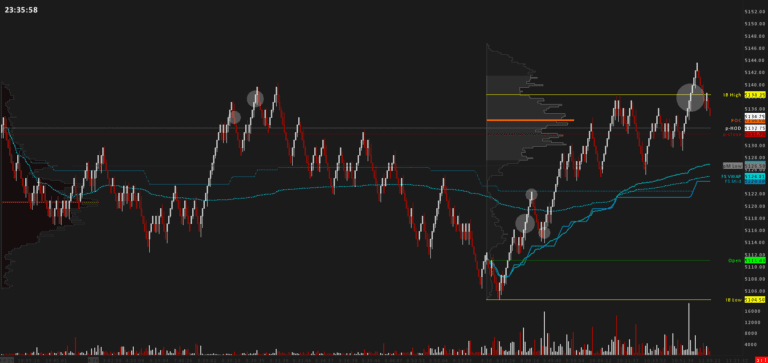
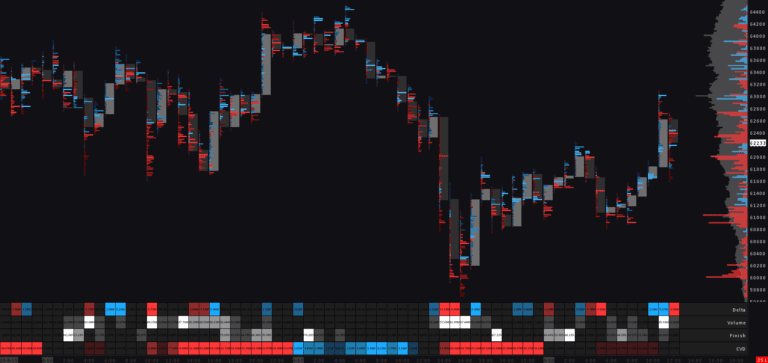
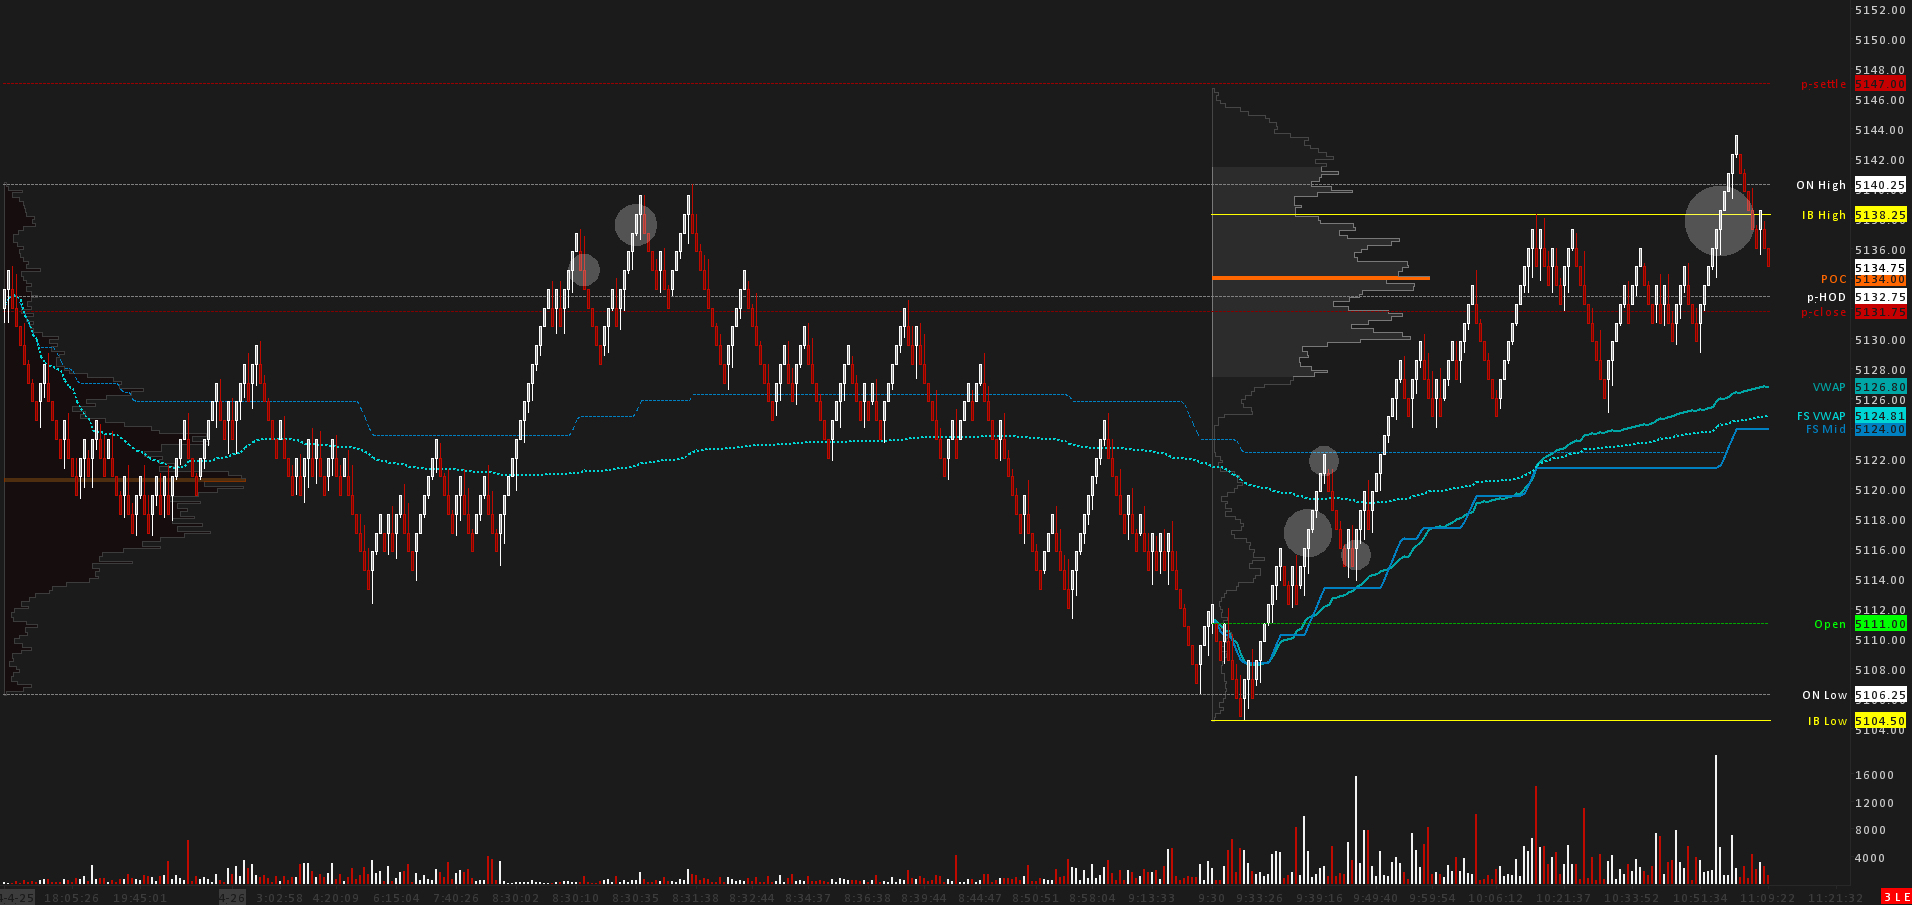
04 · Day LevelsRenko Chart with Day-Generated Levels
Deep into the daily action: all important day-generated levels marked automatically: open, previous close, settlement and more, with a close eye on the overnight session.
more
- Automatically marks every key day-generated level: Open, previous close, prior settlement, prior High/Low, previous-week High/Low, previous-month High/Low, POC, Initial Balance High/Low, Full-Session and Regular-Hours VWAP, Full-Session and Regular-Hours Mid, and overnight High/Low.
- Reads both the overnight and RTH profiles to help you set the daily bias.
- Renko bars are movement-based rather than time-based, so the chart focuses on meaningful activity and filters out noise.
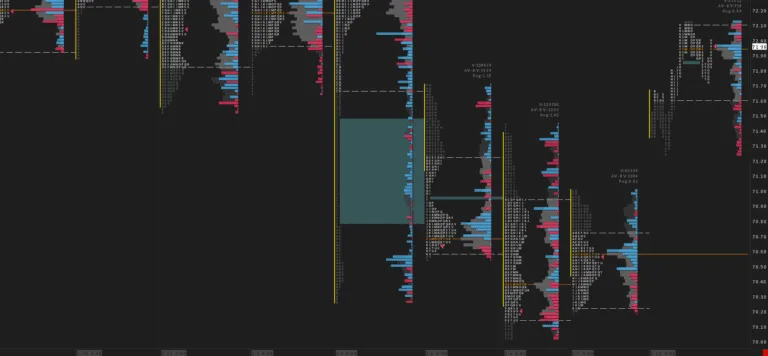
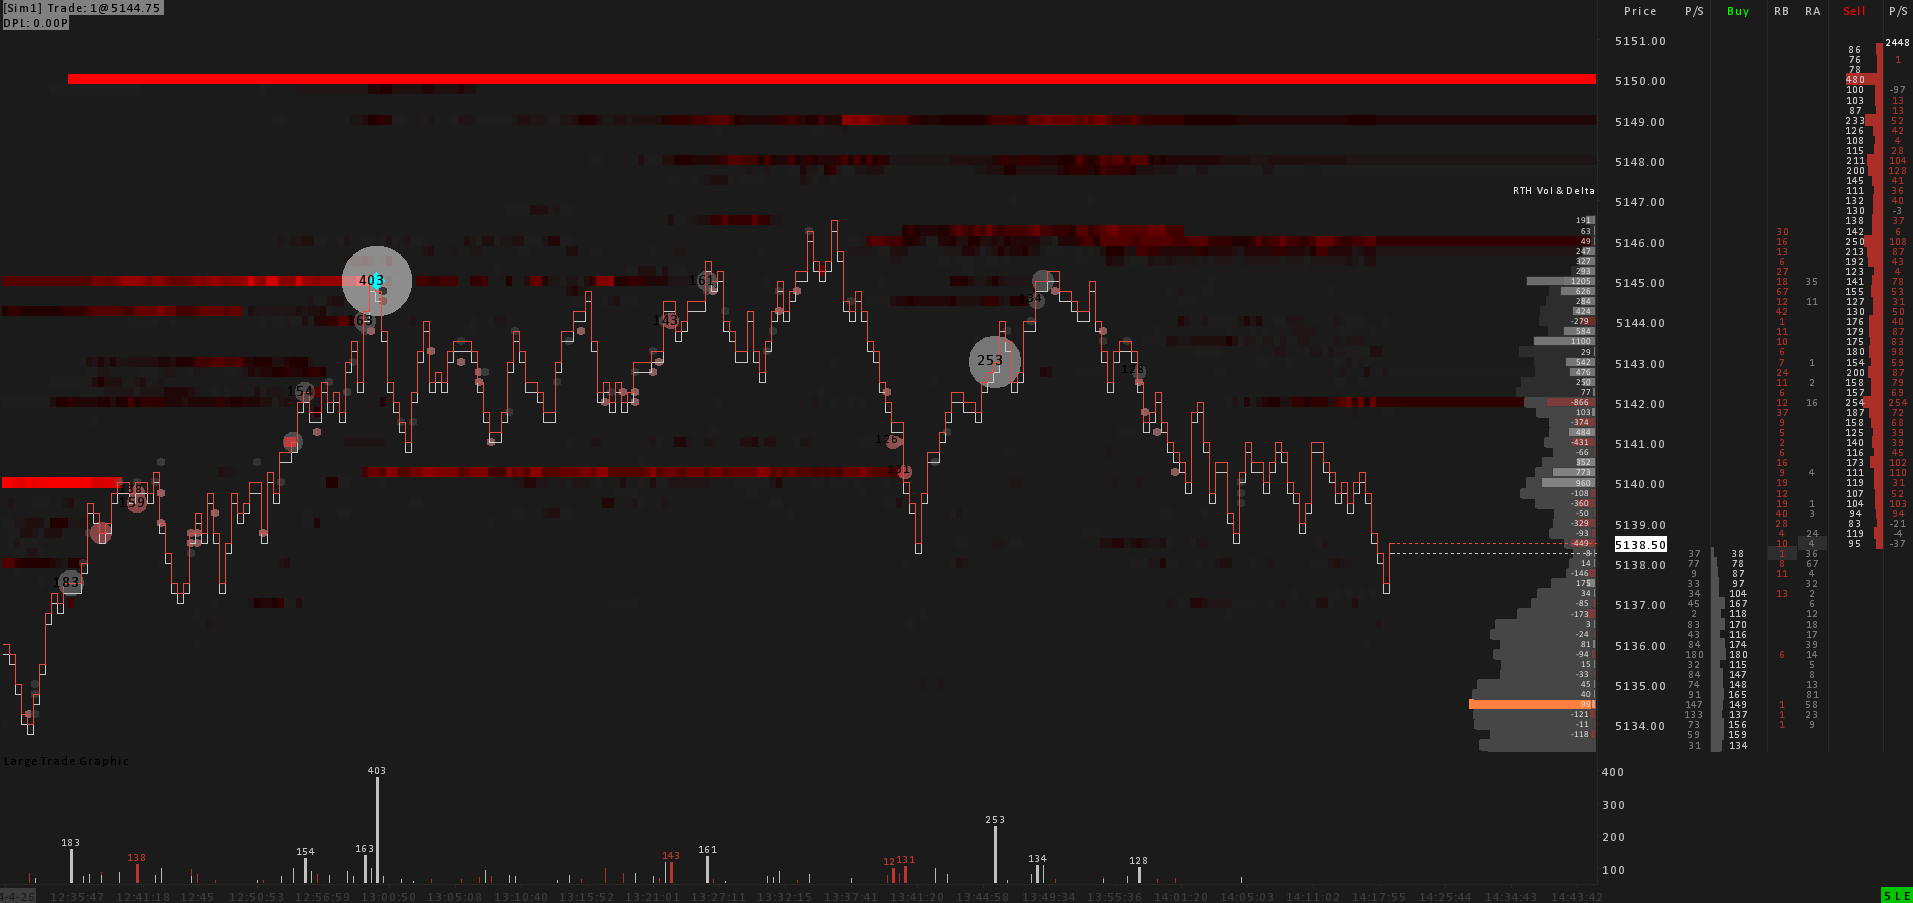
05 · LiquidityOrderflow Heatmap Chart
Orderflow tools for unique insight into market liquidity and potential price movement: liquidity heatmap plus volume and delta profiles, designed for precise decisions inside the integrated DOM.
more
- Liquidity heatmap reveals resting orders and potential price movement.
- Volume and delta profiles add orderflow context.
- Iceberg detector surfaces hidden size.
- Custom-coded large-trade graphics with volume numbers.
- Ready-to-trade integrated DOM for precise decisions.
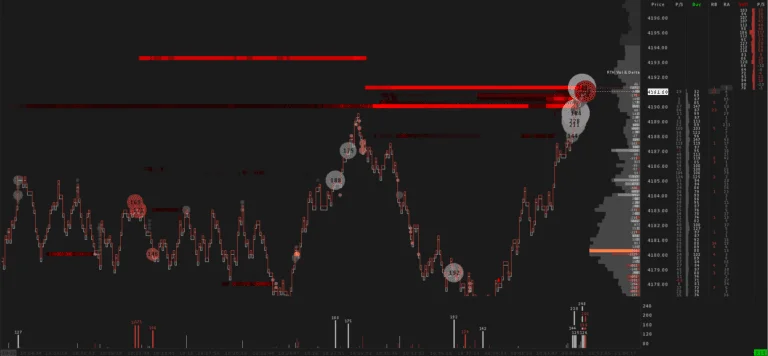
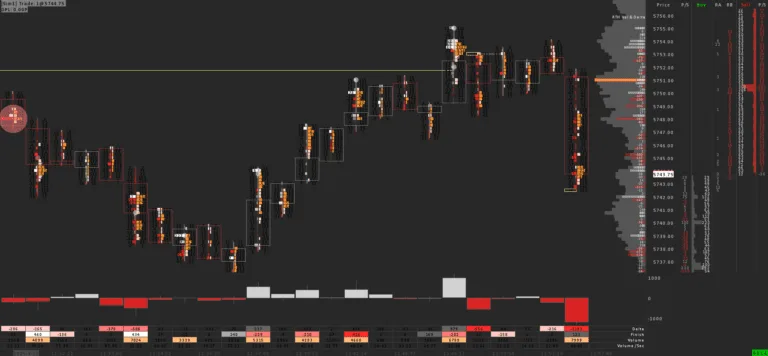
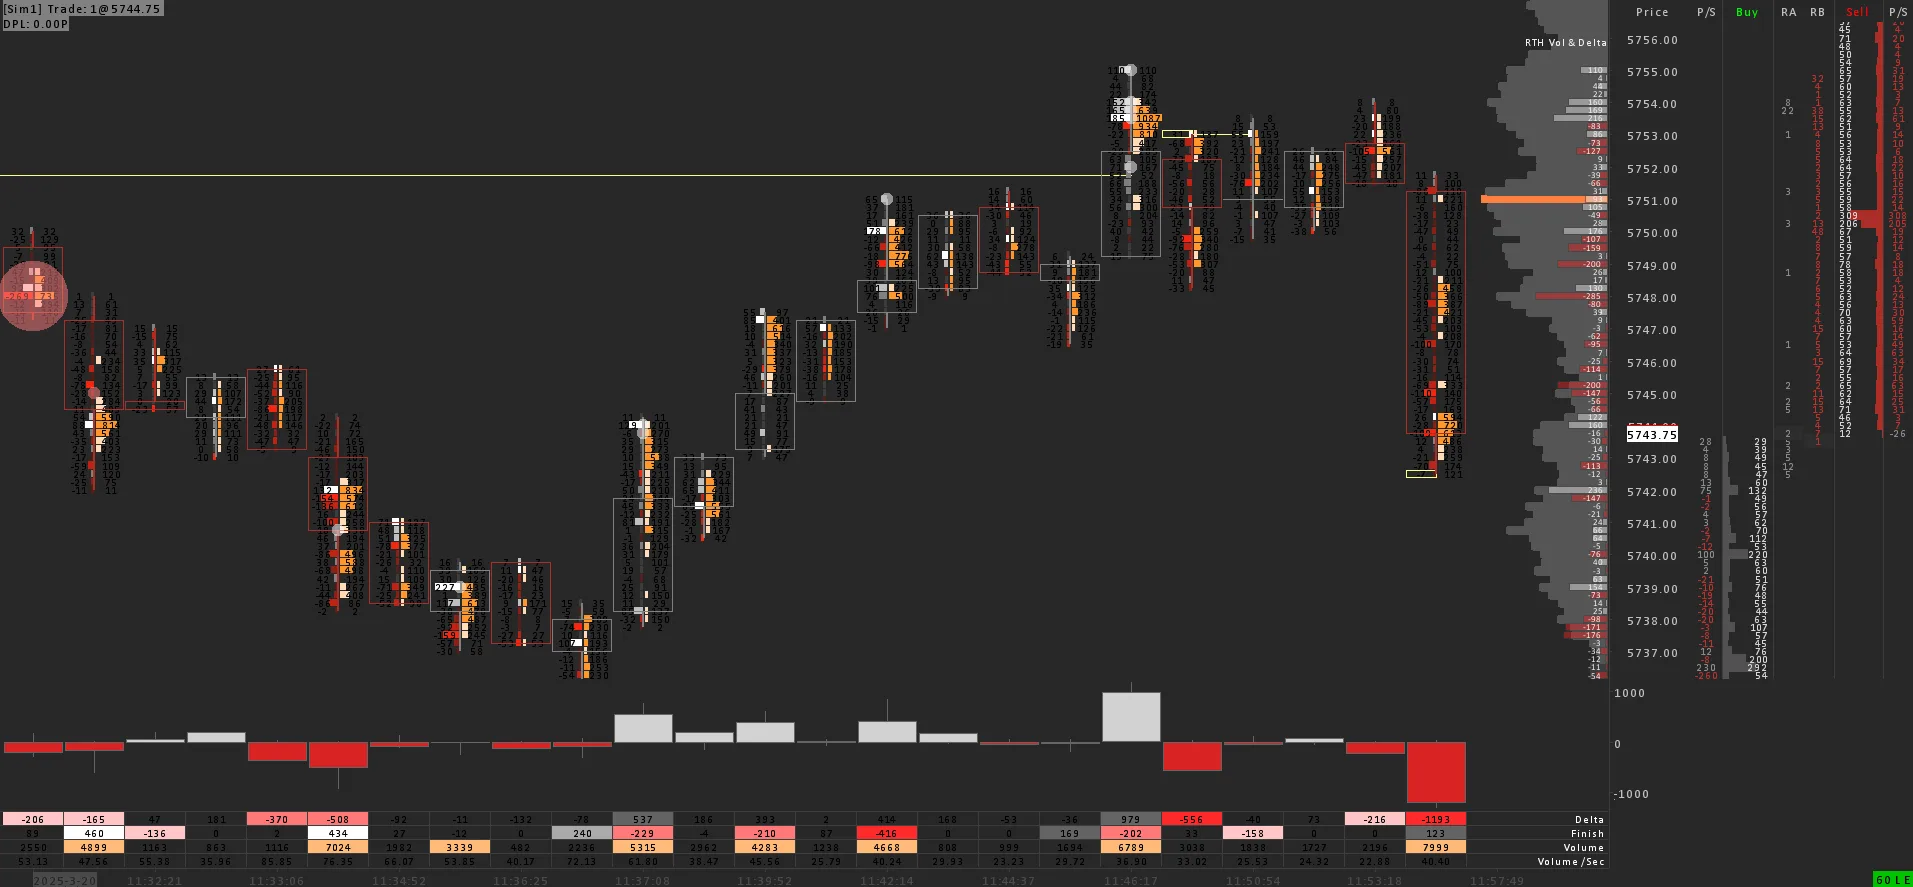
06 · Trigger ChartFootprint - Delta & Total Volume + DOM
Filtered footprint with delta and total volume plus DOM: a specialized trigger chart designed for precise entries. The chart you "pull the trigger" from.
more
- Filtered footprint reduces misleading noise and keeps the focus on meaningful activity.
- Footprint delta in the left column and total volume in the right, plus delta bars.
- Footprint statistics: delta, finish, volume and volume per second.
- Large-volume-trade indicators alongside volume and delta profiles.
- Ready-to-trade integrated DOM for precise entries.
Good to knowFAQ.
What Sierra Chart package do I need?
We recommend Sierra Chart Package 11 for this template.
How do I install the template?
Can I use the template for all products?
Yes. Each version of this template is tuned for a specific market - choose ES (S&P 500), NQ (NASDAQ), Crude Oil and Gold above before adding to cart. For any other instrument, adjust the session times, scaling and volume settings to match.
 Bonus · Free with this suite
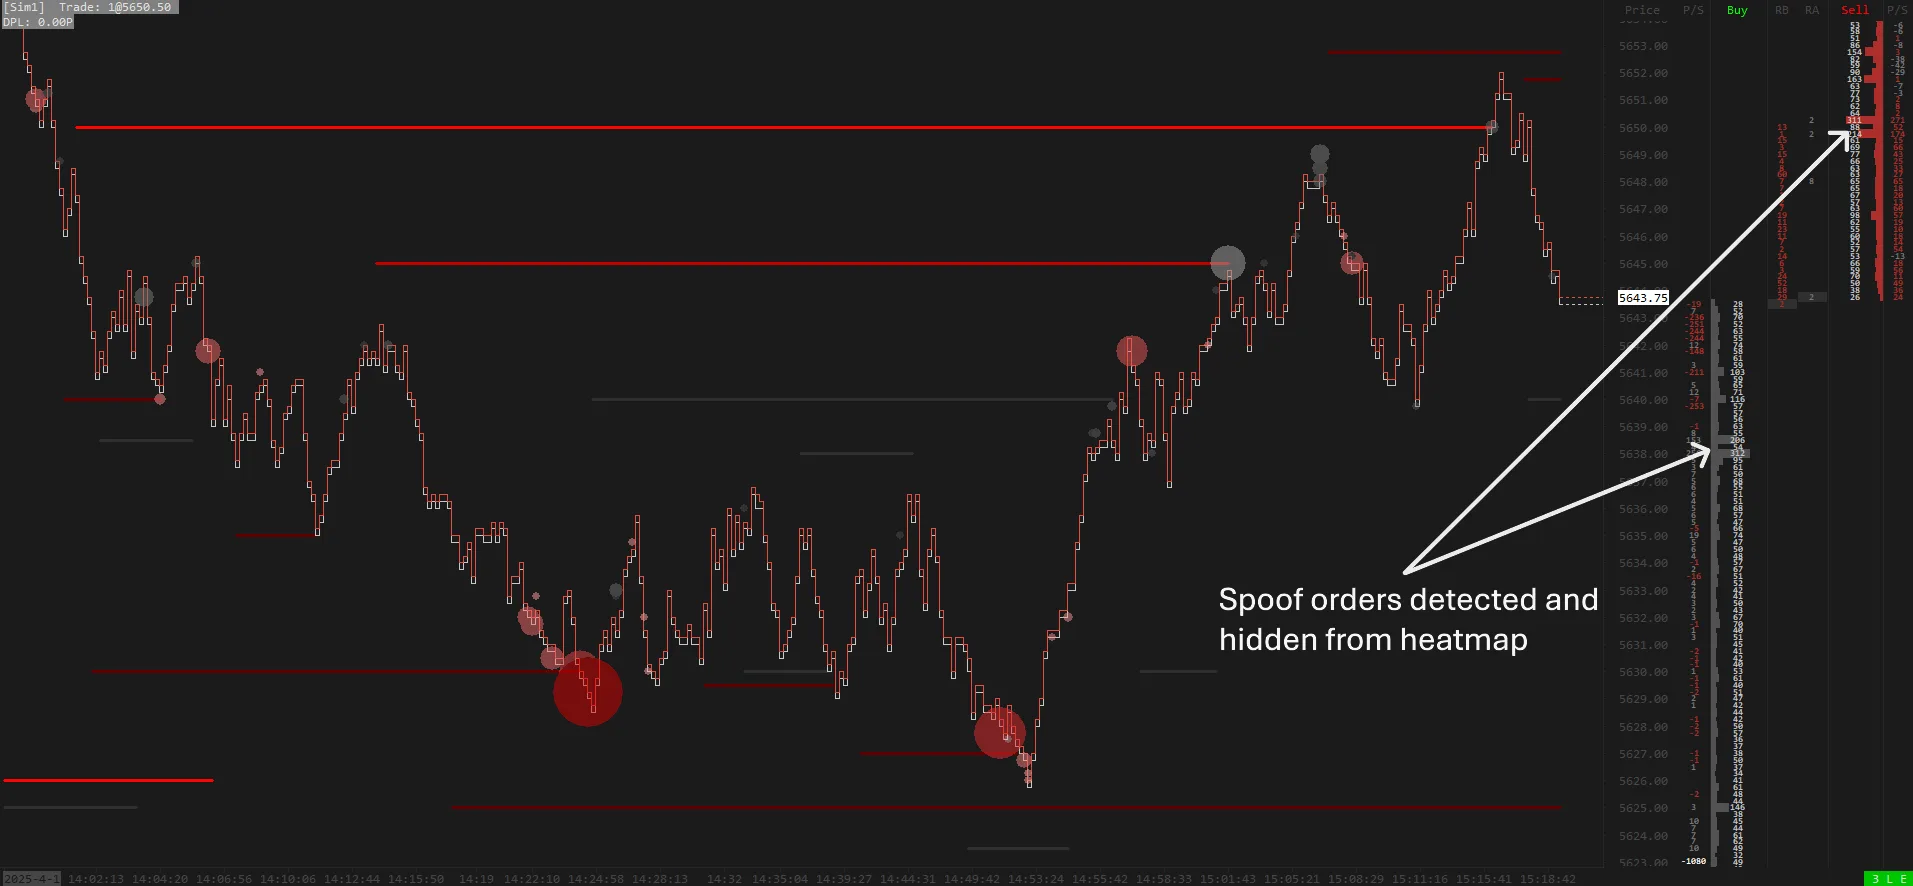
Highlight Resting Liquidity
A custom study that sees through spoofing and smoke-screen algorithms to surface the resting liquidity that actually matters. Works on any DOM market, ES-tuned by default. Free for every Crimson Suite customer.
Explore the study →
Bonus · Free with this suite
Highlight Resting Liquidity
A custom study that sees through spoofing and smoke-screen algorithms to surface the resting liquidity that actually matters. Works on any DOM market, ES-tuned by default. Free for every Crimson Suite customer.
Explore the study →