Templates / Heatmap / ES Orderflow Iceberg Detector
What's Included

Inside this template.

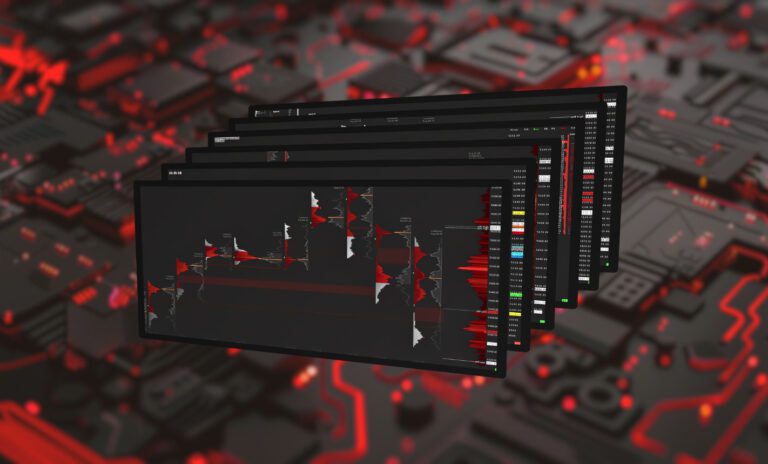
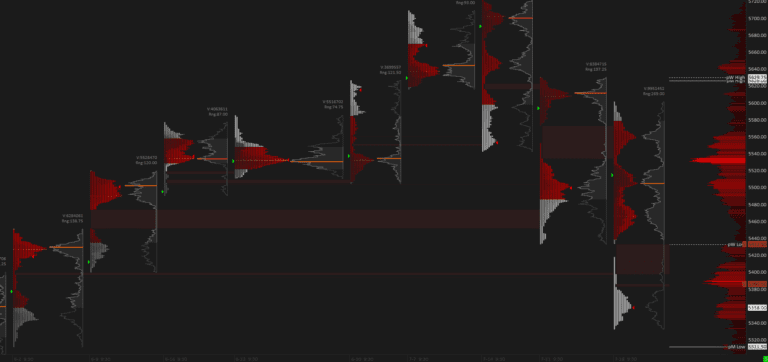
ES Orderflow Iceberg Detector is a Sierra Chart template that helps you find iceberg orders in ES (S&P 500 futures). An iceberg is a large order that only shows a small part of its size in the order book and refills as it gets filled. The template compares bid and ask volume and total traded volume with the market depth and highlights the areas where that hidden size is likely sitting.

What is on the chart

  • Iceberg detection for ES based on market depth data
  • Bid and ask volume differences and total volume calculations at each price
  • Market depth data that highlights areas of interest
  • Large Volume Trade Indicator for single big prints

Why icebergs matter

Large participants rarely show their full size, because a big visible order moves price away before it is filled. So they split it and let the exchange refill it in small pieces. On a normal chart you only see that price stopped. With iceberg detection you see why: much more volume traded at that price than the order book ever showed. That is a strong sign that a big buyer or seller is defending the level.
Good to know

Good to know

FAQ.

What Sierra Chart package do I need?
We recommend Sierra Chart Package 11 for this template.
How do I install the template?
1) Download the included files. 2) Place them in your Sierra Chart Data folder. 3) Open the chartbook. Detailed Installation Guide →
Can I use the template for all products?
Yes. In its default state this template is optimized for ES (S&P 500). For any other instrument, adjust the session times, scaling and volume settings to match. See the official Sierra Chart documentation for guidance.
Scroll to Top