Templates / Footprint / Footprint Crimson
What's Included

Inside this template.

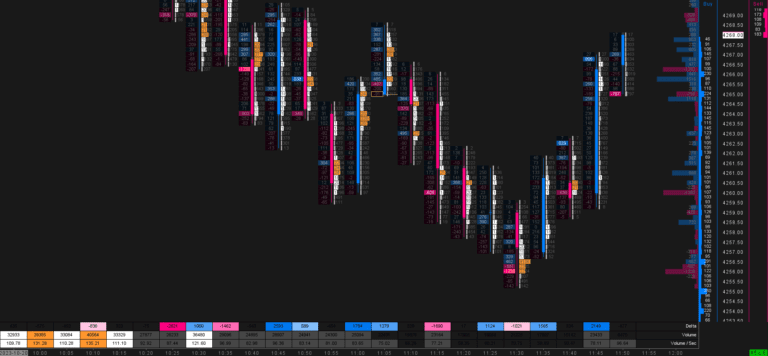
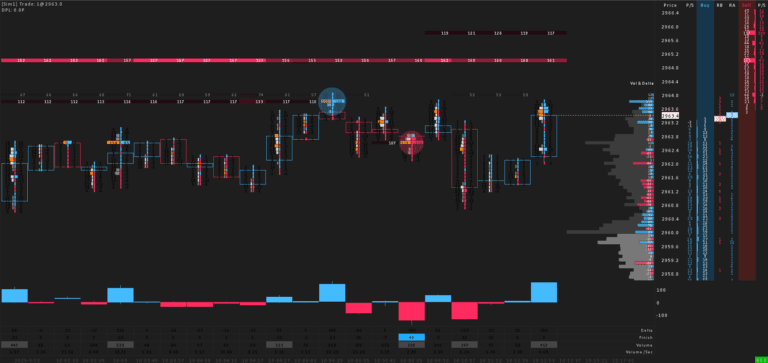
Footprint Crimson is the trigger chart of the Crimson Day Trading Suite, with optimizations for ES, NQ, Crude Oil and Gold futures. It is a filtered Sierra Chart footprint (Numbers Bars) built on range-based Point & Figure bars, so a new bar only prints when price actually moves. A dull session without any movement does not fill your screen with hundreds of bars, so you only see what really happened. Prefer time-based bars? The chart can be switched to a time-based bar period, like minutes, in the chart settings. Delta and total volume sit side by side in every bar and a ready-to-trade DOM is attached, so you read the auction and place the order from the same screen.

What is on the chart

  • Footprint with two columns: delta on the left (white for buying, red for selling) and total volume on the right (orange)
  • Range-based Point & Figure bar type (preset 1-11) with a transparent candlestick body, so the footprint numbers stay readable
  • Volume Profile with total volume and a delta overlay, calculated from all visible bars
  • Delta Bars and footprint statistics under the chart
  • Unfinished tops and bottoms: a yellow line that extends until price comes back to retest the level
  • Large Volume Trade Indicator that marks single big prints inside the bars
  • Integrated, ready-to-trade DOM

How traders use it

The candles are deliberately transparent, so the focus stays on what is happening inside each bar. The chart is optimized to spot absorption and heavily traded volume, which on a zoomed-in level often signal a short-term reversal. Use these readings together with strong finish numbers in the opposite direction.

Unfinished auctions at the high or low of a candle are marked with a yellow horizontal line. They show unfinished business and the market often comes back to them. The line stays extended until price revisits the level and finishes the business. The Delta Bars at the bottom give you visual feedback that confirms what you read in the footprint, whether that is absorption or a strong directional move.
Good to know

  • Optimized for ES, NQ, Crude Oil and Gold. Choose your market on the product page. Need more than one market? Add the other optimizations at a reduced price before you add the template to the cart.
  • Footprint (Numbers Bars) is an Advanced Sierra Chart feature. We recommend Package 11 for live market data.
  • Also included in the Crimson Day Trading Suite, where it is chart 6 of 6. See all Sierra Chart footprint templates.
  • Tip: the Tape On Chart indicator paints the Time and Sales tape directly on your chart, one row per order with big prints highlighted.
Good to know

FAQ.

What Sierra Chart package do I need?
We recommend Sierra Chart Package 11 for this template.
How do I install the template?
1) Download the included files. 2) Place them in your Sierra Chart Data folder. 3) Open the chartbook. Detailed Installation Guide →
Can I use the template for all products?
Yes. Each version of this template is tuned for a specific market - choose ES (S&P 500), NQ (NASDAQ), Crude Oil and Gold above before adding to cart. For any other instrument, adjust the session times, scaling and volume settings to match.
Scroll to Top