Your cart is empty.
No products in the cart.

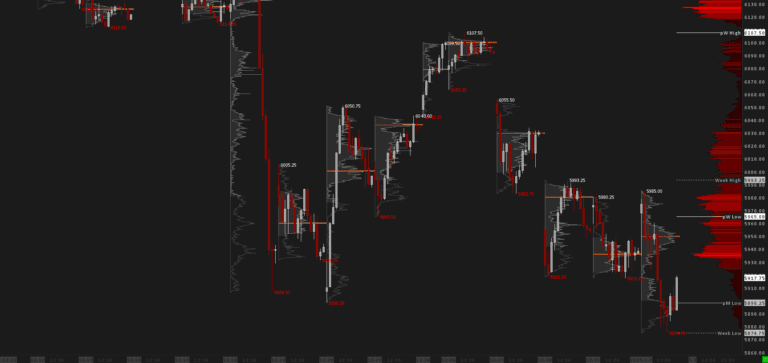
Daily RTH Volume Profiles with Candlestick Crimson is the daily-structure chart of the Crimson Day Trading Suite, with optimizations for ES, NQ, Crude Oil and Gold futures. Each regular-session (RTH) day appears as a candle with its own volume profile and key numbers, so you see the auctions of as many days as you load into the chart, in the Crimson color scheme.
The Crimson Suite reads the market from the top down. The weekly TPO shows the bigger themes. This chart narrows it to individual days: which sessions trended, which ones balanced and where each one did most of its business. Then the 30-minute profile and the Renko day levels take you into today’s session.
The Average Daily Range graph tells you how far the market usually travels in a regular session. If today’s range has already reached its average by mid-morning, chasing a breakout gets riskier and fading the extremes gets more interesting. If the market is still compressed, a range expansion is more likely ahead.
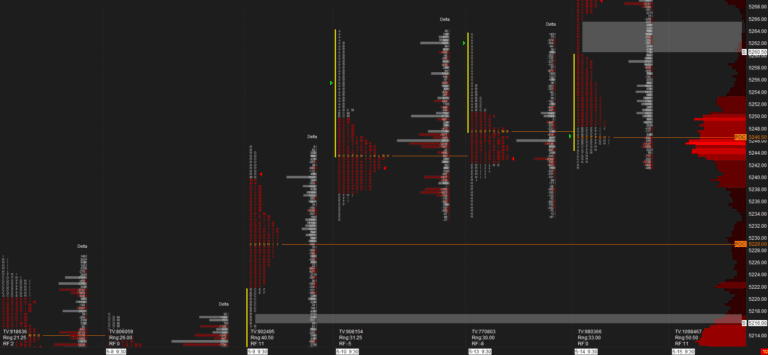
The numbers under each daily profile summarize volume, delta and range, so every session gives you detailed insight at a glance.